OPEN-SOURCE SCRIPT
BTC - AUI 1: Macro Sentiment & On-Chain Composite
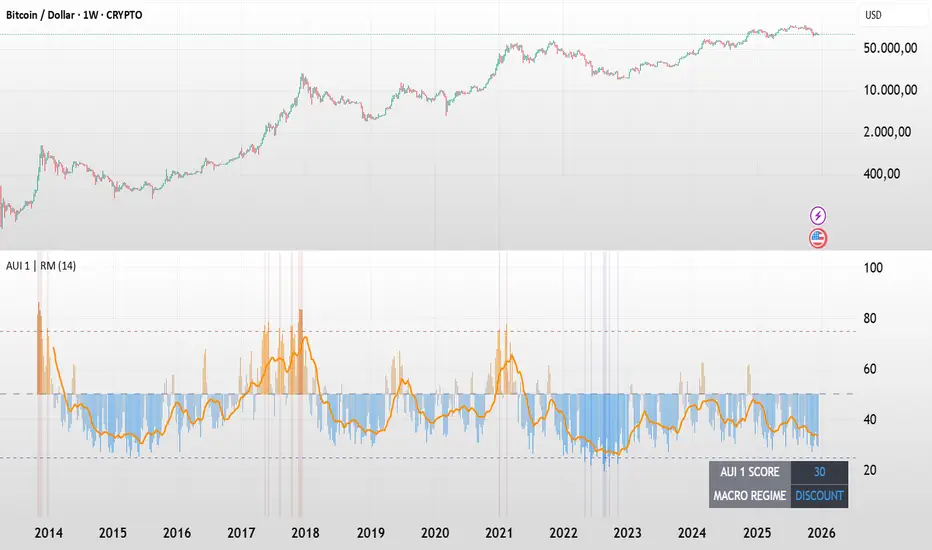
BTC - AUI 1: Macro Sentiment & On-Chain Composite | RM
Overview & Philosophy The AUI 1 (Another Ultimate Indicator, Volume 1) is a 10-pillar quantitative composite designed to solve the "noise problem" in Bitcoin analysis. Most traders fail because they rely on a single metric in isolation. The AUI 1 aggregates ten distinct dimensions of the network — from speculative flow to institutional extension — into a singular 0–100 score.
The 10-Pillar Quant Framework
Each pillar is mathematically normalized to a standardized 0 to 10 scale. The sum of these pillars creates the final 0–100 index:
1. BEAM (Adaptive Logarithmic Multiple)
• Method: Log-deviation from the 4-year cycle mean.
• Logic: Measures price distance from its fundamental growth curve.
(Credit: BitcoinEcon)
2. MVRV Z-Score (Statistical Distance)
• Method: Standard deviations between Market Cap and Realized Cap.
• Logic: Identifies historical "Fair Value" vs. "Bubble" extremes.
(Credit: M. Mahmudov & D. Puell)
3. Metcalfe’s Law (Network Utility)
• Method: Logarithmic scaling of Active Addresses.
• Logic: Ensures price growth is supported by actual user adoption.
(Credit: T. Peterson)
4. RHODL Proxy (Speculative Flow)
• Method: Supply rotation intensity between HODLers and New Money.
• Logic: Cycle peaks are defined by "Old Money" distributing to "New Money."
(Credit: Philip Swift)
5. AXIS Momentum (Structural Trend Intensity)
• Method: Dual-speed Rate of Change (RoC) fusion engine.
• Logic: Identifies the acceleration and "torque" of the macro trend.
(Credit: Rob_Maths)
6. Mayer Multiple (Institutional Extension)
• Method: Raw distance from the 200-day SMA.
• Logic: Tracks the primary anchor used by institutional mean-reversion desks.
(Credit: Trace Mayer)
7. Unrealized Profit (Financial Pressure)
• Method: Absolute MVRV Ratio mapping.
• Logic: Measures the financial "stress" or "greed" held by the average holder.
8. Retail Participation (Psychology Proxy)
• Method: Inverted Log-Average Transaction Size (USD).
• Logic: Declining transaction sizes historically signal retail FOMO (Euphoria).
9. Volatility Overextension (Structural Risk)
• Method: 30-day Standard Deviation relative to the mean.
• Logic: High-intensity volatility clusters often precede cycle trend-shifts.
10. Macro RSI (Cycle Maturity)
• Method: High-timeframe momentum saturation levels.
• Logic: Identifies the statistical "Buying Exhaustion" of a macro move.
(Credit: J. Welles Wilder Jr.)
How to Read the AXIS Quadrants
The AUI 1 uses a Seamless Heatmap to categorize the market into four specific macro regimes:
❄️ 0–25: FROZEN (Deep Blue) Maximum Opportunity. Structural capitulation where only long-term conviction remains. Historically the "Generational Wealth" window.
🔵 25–50: DISCOUNT (Light Blue to Gray) Value Accumulation. The market is cooling down; risk is mathematically low, and the network is building a structural floor.
🟠 50–75: EXPANSION (Gray to Orange) Trend Acceleration. Healthy bullish growth supported by network utility and positive momentum.
🔥 75–100: SCORCHED (Orange to Deep Red) Terminal Euphoria. Maximum Risk zone. Speculative FOMO is at its peak; the market is fundamentally overextended.
The Orange Signal Line
To filter short-term noise, the AUI 1 includes a Signal Smoothing Line (Parametrizable).
• Cycle Confirmation: Index Bars crossing above the Signal Line indicates trend acceleration.
• Peak Confirmation: If the Index Score rolls over and breaks below the Signal Line while in the SCORCHED zone, the cycle peak is likely confirmed.
Credits & Data Built by Rob_Maths (2025) using on-chain frameworks from Glassnode and IntoTheBlock. Special recognition to the pioneers: Murad Mahmudov, David Puell, Philip Swift, Trace Mayer, and Timothy Peterson.
Strategic Recommendation: For the most accurate macro cycle signals and to filter daily market noise, it is strongly recommended to use this indicator on the Weekly (1W) timeframe.
⚠️ Data Requirement Note: This quantitative composite utilizes professional on-chain data feeds, specifically GLASSNODE:BTC_ACTIVEADDRESSES, GLASSNODE:BTC_ACTIVE1Y, and INTOTHEBLOCK:BTC_MVRV. A TradingView paid plan (Essential or higher) may be required to access these institutional data streams.
Disclaimer This script is for macro-economic research purposes. It is a probabilistic model, not a crystal ball. Past performance is not a guarantee of future results.
Tags:
bitcoin, btc, on-chain, macro, composite, mvrv, rhodl, momentum, index, valuation, active-addresses, cycles, sentiment, risk, AUI, Rob Maths
Skrip sumber terbuka
Dalam semangat TradingView sebenar, pencipta skrip ini telah menjadikannya sumber terbuka, jadi pedagang boleh menilai dan mengesahkan kefungsiannya. Terima kasih kepada penulis! Walaupuan anda boleh menggunakan secara percuma, ingat bahawa penerbitan semula kod ini tertakluk kepada Peraturan Dalaman.
Penafian
Maklumat dan penerbitan adalah tidak bertujuan, dan tidak membentuk, nasihat atau cadangan kewangan, pelaburan, dagangan atau jenis lain yang diberikan atau disahkan oleh TradingView. Baca lebih dalam Terma Penggunaan.