OPEN-SOURCE SCRIPT
Kitti-Playbook ATR Study R0
Date : Aug 22 2025
Kitti-Playbook ATR Study R0
This is used to study the operation of the ATR Trailing Stop on the Long side, starting from the calculation of True Range.
1) Studying True Range Calculation
1.1) Specify the Bar graph you want to analyze for True Range. Enable "Show Selected Price Bar" to locate the desired bar.
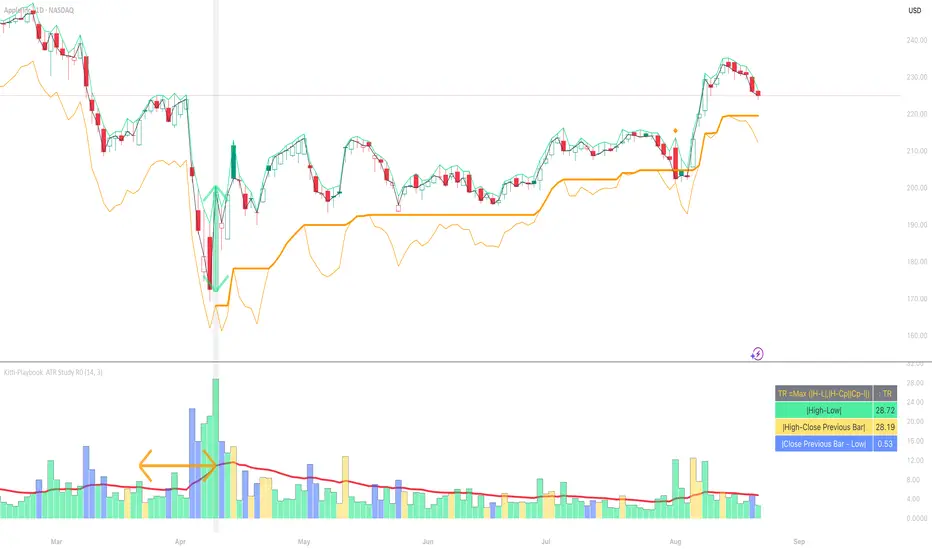
1.2) Enable/disable "Display True Range" in the Settings. True Range is calculated as: TR = Max (|H - L|, |H - Cp|, |Cp - L|)
• Show True Range: Each color on the bar represents the maximum range value selected:
◦ |H - L| = Green
◦ |H - Cp| = Yellow
◦ |Cp - L| = Blue
• Show True Range on Selected Price Bar: An arrow points to the range, and its color represents the maximum value chosen:
◦ |H - L| = Green
◦ |H - Cp| = Yellow
◦ |Cp - L| = Blue
• Show True Range Information Table: Displays the actual values of |H - L|, |H - Cp|, and |Cp - L| from the selected bar.
2) Studying Average True Range (ATR)
2.1) Set the ATR Length in Settings. Default value: ATR Length = 14
2.2) Enable/disable "Display Average True Range (RMA)" in Settings:
• Show ATR
• Show ATR Length from Selected Price Bar (An arrow will point backward equal to the ATR Length)
3) Studying ATR Trailing
3.1) Set the ATR Multiplier in Settings. Default value: ATR Multiply = 3
3.2) Enable/disable "Display ATR Trailing" in Settings:
• Show High Line
• Show ATR Bands
• Show ATR Trailing
4) Studying ATR Trailing Exit
(Occurs when the Close price crosses below the ATR Trailing line)
Enable/disable "Display ATR Trailing" in Settings:
• Show Close Line
• Show Exit Points (Exit points are marked by an orange diamond symbol above the price bar)
Skrip sumber terbuka
Dalam semangat TradingView sebenar, pencipta skrip ini telah menjadikannya sumber terbuka, jadi pedagang boleh menilai dan mengesahkan kefungsiannya. Terima kasih kepada penulis! Walaupuan anda boleh menggunakan secara percuma, ingat bahawa penerbitan semula kod ini tertakluk kepada Peraturan Dalaman.
Penafian
Maklumat dan penerbitan adalah tidak bertujuan, dan tidak membentuk, nasihat atau cadangan kewangan, pelaburan, dagangan atau jenis lain yang diberikan atau disahkan oleh TradingView. Baca lebih dalam Terma Penggunaan.