OPEN-SOURCE SCRIPT
Telah dikemas kini Average Yield Inversion
Description:
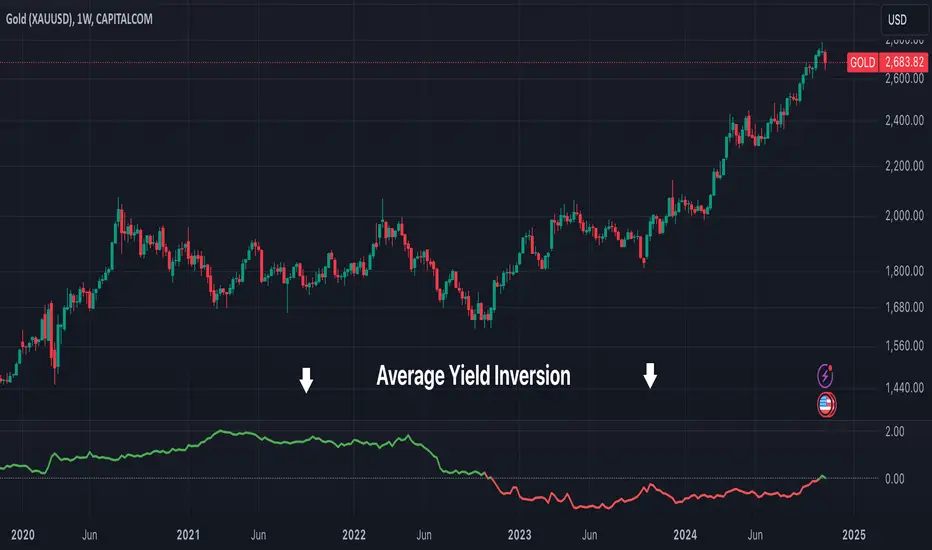
This script calculates and visualizes the average yield curve spread to identify whether the yield curve is inverted or normal. It takes into account short-term yields (1M, 3M, 6M, 2Y) and long-term yields (10Y, 30Y).
Key Features:
This tool is perfect for investors, analysts, and economists who need to monitor yield curve dynamics at a glance.
This script calculates and visualizes the average yield curve spread to identify whether the yield curve is inverted or normal. It takes into account short-term yields (1M, 3M, 6M, 2Y) and long-term yields (10Y, 30Y).
- Positive values: The curve is normal, indicating long-term yields are higher than short-term yields. This often reflects economic growth expectations.
- Negative values: The curve is inverted, meaning short-term yields are higher than long-term yields, a potential signal of economic slowdown or recession.
Key Features:
- Calculates the average spread between long-term and short-term yields.
- Displays a clear graph with a zero-line reference for quick interpretation.
- Useful for tracking macroeconomic trends and potential market turning points.
This tool is perfect for investors, analysts, and economists who need to monitor yield curve dynamics at a glance.
Nota Keluaran
Added red color for inversion and green for non inversionNota Keluaran
Update: removed Chart to show the indicator onlyNota Keluaran
Update: added symbol and chart for comparisonNota Keluaran
Update: added titleSkrip sumber terbuka
Dalam semangat TradingView sebenar, pencipta skrip ini telah menjadikannya sumber terbuka, jadi pedagang boleh menilai dan mengesahkan kefungsiannya. Terima kasih kepada penulis! Walaupuan anda boleh menggunakan secara percuma, ingat bahawa penerbitan semula kod ini tertakluk kepada Peraturan Dalaman.
Penafian
Maklumat dan penerbitan adalah tidak bertujuan, dan tidak membentuk, nasihat atau cadangan kewangan, pelaburan, dagangan atau jenis lain yang diberikan atau disahkan oleh TradingView. Baca lebih dalam Terma Penggunaan.
Skrip sumber terbuka
Dalam semangat TradingView sebenar, pencipta skrip ini telah menjadikannya sumber terbuka, jadi pedagang boleh menilai dan mengesahkan kefungsiannya. Terima kasih kepada penulis! Walaupuan anda boleh menggunakan secara percuma, ingat bahawa penerbitan semula kod ini tertakluk kepada Peraturan Dalaman.
Penafian
Maklumat dan penerbitan adalah tidak bertujuan, dan tidak membentuk, nasihat atau cadangan kewangan, pelaburan, dagangan atau jenis lain yang diberikan atau disahkan oleh TradingView. Baca lebih dalam Terma Penggunaan.