OPEN-SOURCE SCRIPT
Algo MA💎 (V.4.3)
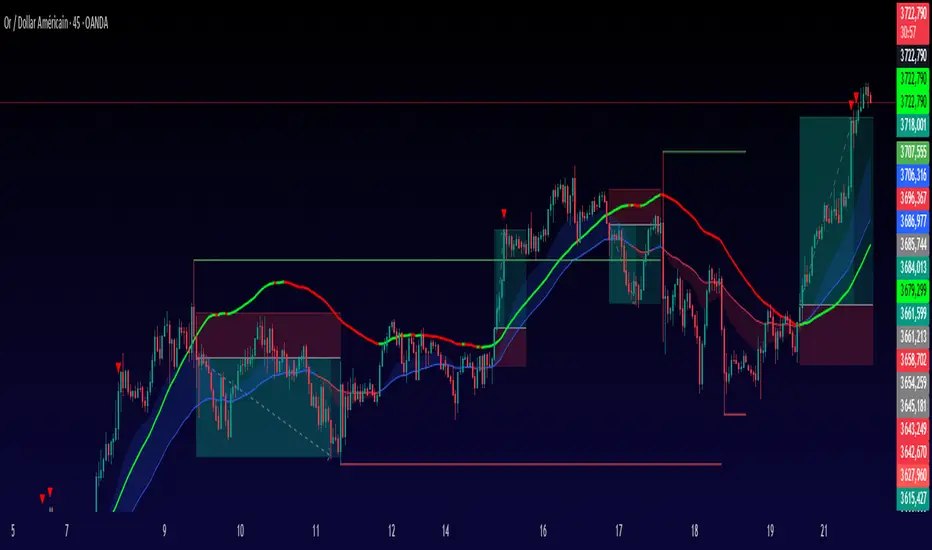
Algo MA💎 V.4.3 - Multi-EMA System with Advanced Candle Analysis
**Algo MA💎 V.4.3** is a comprehensive trend analysis system that combines multiple EMA configurations with advanced candle coloring, support/resistance detection, and integrated trade management dashboards. This indicator provides a complete visual trading environment with sophisticated trend identification and portfolio tracking capabilities.
**Core Innovation & Originality**
This system uniquely integrates seven distinct analytical components:
1. **Dual-EMA Signal Engine** - Primary trend detection using 9/21 EMA crossovers with customizable sensitivity
2. **Advanced Candle Classification** - Multi-layer candle coloring with two sensitivity levels (violet/rose) based on ATR calculations
3. **Trend Confirmation System** - Secondary 20/50 EMA trend filter with dynamic cloud visualization
4. **Zero Lag EMA Implementation** - 144-period Zero Lag EMA with directional color coding for reduced lag trend analysis
5. **RSI Extreme Detection** - Overbought (75) and oversold (25) level identification with visual markers
6. **Dynamic Support/Resistance** - Pivot-based support and resistance level calculation with 50-bar lookback
7. **Integrated Trade Management** - Three customizable dashboard tables for real-time portfolio tracking
**System Architecture & Functionality**
**Primary Signal Generation:**
The core system uses a 9-period EMA and 21-period EMA comparison to generate directional bias. When EMA9 > EMA21, the system indicates bullish conditions; when EMA9 < EMA21, it signals bearish conditions. This creates the foundation for all visual elements and trend analysis.
**Advanced Candle Coloring Logic:**
The system employs a sophisticated three-layer candle coloring approach:
- **Green Candles**: EMA9 > EMA21 (bullish trend)
- **Red Candles**: EMA9 < EMA21 (bearish trend)
- **Violet Candles**: EMAs within sensitivity_violet * ATR(14) range (consolidation)
- **Rose Candles**: EMAs within sensitivity_rose * ATR(14) range (tight consolidation)
**Sensitivity-Based Classification:**
Two independent sensitivity parameters allow fine-tuning of consolidation detection:
- **Violet Sensitivity (0.3 default)**: Broader consolidation zones
- **Rose Sensitivity (0.1 default)**: Tighter consolidation zones
**Zero Lag EMA Implementation:**
Uses advanced calculation: `zlema = ema(src + src - src[lag], length)` where lag = floor((length-1)/2). This reduces the inherent lag of traditional EMAs while maintaining smoothness.
**Trend Confirmation Framework:**
The 20/50 EMA system provides trend context with visual cloud fills:
- **Blue Cloud**: 20 EMA > 50 EMA (bullish trend environment)
- **Red Cloud**: 20 EMA < 50 EMA (bearish trend environment)
**Unique Visual Features**
**Multi-Layer Candle System:**
The indicator plots up to four candle layers simultaneously:
1. **Base Candles**: Primary EMA-based trend colors
2. **Violet Consolidation**: ATR-adjusted consolidation detection
3. **Rose Consolidation**: Tighter consolidation identification
4. **Bearish Overlay**: Optional bearish candle highlighting
**Support/Resistance Detection:**
Uses pivot point calculations with 50-bar left and right parameters:
- **Green Lines**: Resistance levels from pivot highs
- **Red Lines**: Support levels from pivot lows
- **Dynamic Updates**: Lines adjust based on price action
**RSI Extreme Markers:**
- **Red Triangles**: First occurrence of RSI > 75 (overbought)
- **Green Triangles**: First occurrence of RSI < 25 (oversold)
**Integrated Dashboard System**
**Trade Management Tables:**
Three independent dashboard tables provide comprehensive trade tracking:
- **Stock Information**: Ticker symbol and trade direction (BUY/SELL)
- **Order Details**: Entry price, stop loss, and take profit levels
- **Position Status**: Real-time trade monitoring with color-coded status
**Dashboard Customization:**
- **Positioning**: Bottom-right, bottom-center, bottom-left placement options
- **Color Coding**: Green for BUY positions, red for SELL positions
- **Manual Entry**: User-customizable fields for trade parameters
**Volume Analysis Integration**
**Volume Oscillator:**
Implements short (5) and long (10) EMA volume comparison:
`osc = 100 * (short_volume_ema - long_volume_ema) / long_volume_ema`
This provides additional confirmation for trend strength and potential reversals.
**Usage Instructions**
**Trend Identification:**
- **Primary Trend**: Monitor 9/21 EMA relationship and candle colors
- **Trend Strength**: Observe Zero Lag EMA color (green=bullish, red=bearish)
- **Trend Context**: Use 20/50 EMA cloud for higher timeframe bias
**Entry Signal Recognition:**
- **Bullish Setup**: Green candles + blue trend cloud + support level test
- **Bearish Setup**: Red candles + red trend cloud + resistance level test
- **Consolidation**: Violet/rose candles indicate ranging conditions
**Risk Management Application:**
- **Support/Resistance**: Use pivot levels for stop placement and targets
- **RSI Extremes**: Monitor overbought/oversold conditions for reversal potential
- **Dashboard Tracking**: Utilize tables for position management
**Advanced Analysis:**
- **Sensitivity Adjustment**: Modify violet/rose parameters for market volatility
- **Multi-Timeframe**: Apply system across different timeframes for confluence
- **Volume Confirmation**: Use volume oscillator for signal validation
**Customization Options**
**EMA Parameters:**
- **Main Flow EMAs**: Adjustable 9/21 period settings
- **Trend EMAs**: Customizable 20/50 period configuration
- **Zero Lag EMA**: Modifiable 144-period length
**Visual Settings:**
- **Candle Display**: Toggle bearish candle overlay
- **Trend Visualization**: Show/hide trend cloud and EMAs
- **Support/Resistance**: Enable/disable pivot level display
- **RSI Markers**: Control overbought/oversold triangle display
**Dashboard Configuration:**
- **Table Display**: Independent control for three dashboard tables
- **Trade Details**: Customizable entry, stop, and target fields
- **Position Status**: Manual BUY/SELL/neutral designation
**Alert System**
Built-in alert conditions for:
- **Bullish Signal**: EMA9 crosses above EMA21
- **Bearish Signal**: EMA9 crosses below EMA21
**Important Considerations**
This system works optimally in trending markets with clear directional bias. During consolidation periods, focus on violet/rose candle identification and range-bound strategies. The multiple EMA layers provide comprehensive trend analysis but may generate conflicting signals during choppy conditions.
The dashboard tables serve as trade management tools but require manual input for position tracking. The system combines established EMA techniques with original sensitivity-based consolidation detection and advanced visual presentation methods.
**Disclaimer**: This indicator is designed for educational and analytical purposes. The dashboard tables are for position tracking only and do not execute trades automatically. Past performance does not guarantee future results. Always implement proper risk management and consider multiple confirmation methods before making trading decisions.
Skrip sumber terbuka
Dalam semangat sebenar TradingView, pencipta skrip ini telah menjadikannya sumber terbuka supaya pedagang dapat menilai dan mengesahkan kefungsiannya. Terima kasih kepada penulis! Walaupun anda boleh menggunakannya secara percuma, ingat bahawa menerbitkan semula kod ini adalah tertakluk kepada Peraturan Dalaman kami.
Penafian
Maklumat dan penerbitan adalah tidak dimaksudkan untuk menjadi, dan tidak membentuk, nasihat untuk kewangan, pelaburan, perdagangan dan jenis-jenis lain atau cadangan yang dibekalkan atau disahkan oleh TradingView. Baca dengan lebih lanjut di Terma Penggunaan.