OPEN-SOURCE SCRIPT
The Bounded Slope Indicator
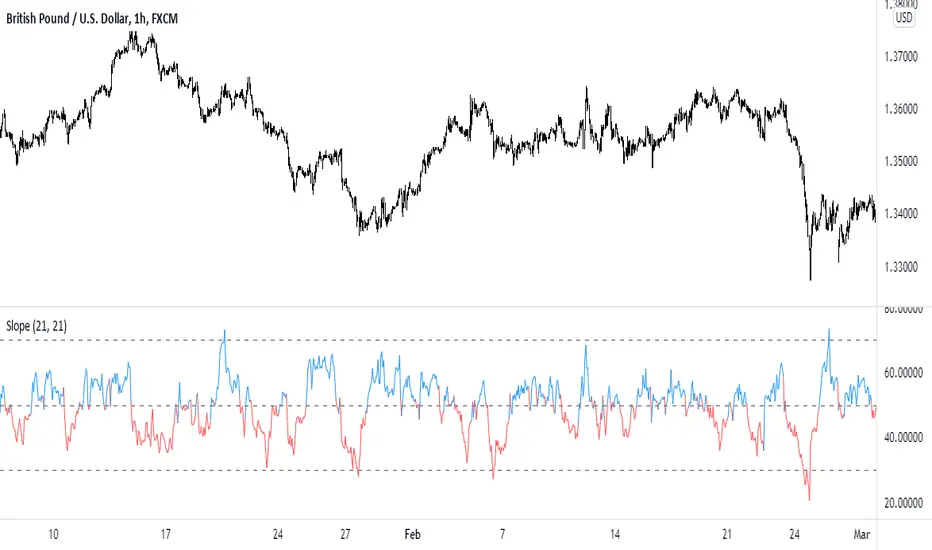
This indicator uses the concept of slopes and normalizes the values so that they are bounded between 0 and 100. The steps required to calculate the indicator are as follows:
* Calculate the slope of the price using a lookback period (by default, it is either 14 or 21). The slope is calculated by subtracting the current close price from the close price 21 (or 14) periods ago and dividing the result by 21 (or 14).
* Calculate the RSI of the slope calculations to get a normalized slope indicator.
The bounded slope indicator can be used the same way as the RSI:
* Through oversold and overbought levels. A bullish bias is present whenever the indicator is close to its oversold level (by default, it is 30) and a bearish bias is present whenever the indicator is close to its overbought level (by default, it is 70).
* Through the divergence technique. A bullish bias is present whenever the indicator is making higher lows and the market is making lower lows. A bearish bias is present whenever the indicator is making lower highs and the market is making higher highs.
The main advantage of the indicator is its different approach to measuring momentum which can be a good uncorrelated indicator to other classical ones (such as the stochastic oscillator and the MACD).
Skrip sumber terbuka
Dalam semangat TradingView sebenar, pencipta skrip ini telah menjadikannya sumber terbuka, jadi pedagang boleh menilai dan mengesahkan kefungsiannya. Terima kasih kepada penulis! Walaupuan anda boleh menggunakan secara percuma, ingat bahawa penerbitan semula kod ini tertakluk kepada Peraturan Dalaman.
Penafian
Maklumat dan penerbitan adalah tidak bertujuan, dan tidak membentuk, nasihat atau cadangan kewangan, pelaburan, dagangan atau jenis lain yang diberikan atau disahkan oleh TradingView. Baca lebih dalam Terma Penggunaan.