OPEN-SOURCE SCRIPT
"DSS" Bessert Double Smooth Stochastic Alma Variant
Hi colleagues I share this time DSS bressert.
As usual they have all the adjustable colors and signals. I hope you enjoy them and leave here below the length of signals that best suit your needs so that we can continue sharing content
Description
One after the other, William Blau and Walter Bressert each presented a version of the Double Smoothed Stochastics. Two exponentially smoothed MAs are used to even out the input values (H, L and C), in a similar way to the well-known stochastic formula.
Parameters
The adjustable period length can be chosen from 2 to 500. The most common settings will have a period length ranging from 5 to 30. In addition, the indicator can be smoothed in the interval from 1 to 50. Meaningful smoothing values lie in the short-term range.
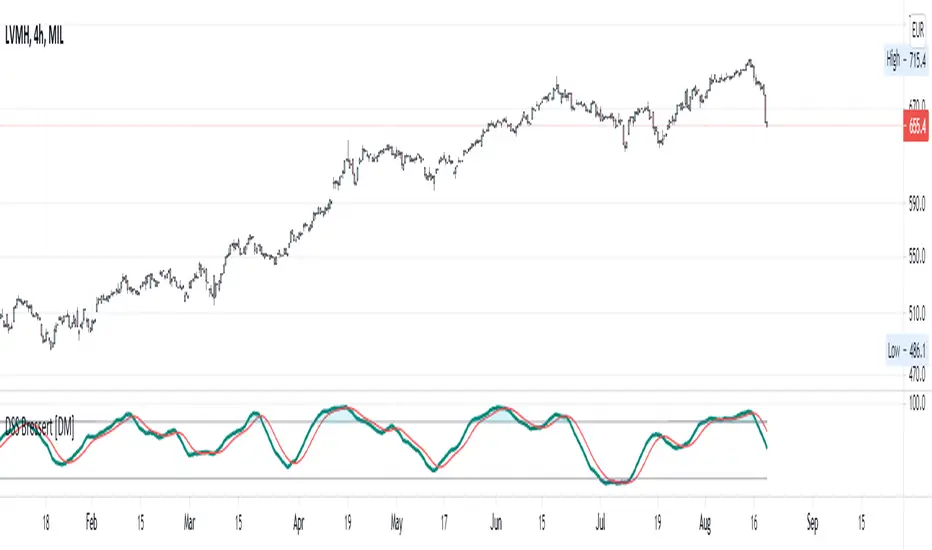
Interpretation
The application of the DSS is comparable with that of the stochastic method. Accordingly, values above 70 or 80 must be regarded as overbought and values below 20 or 30 as oversold. A rise of the DSS above its center line should be viewed as bullish, and a fall of the DSS below its center line as bearish.
/// Quick Explained ALMA ///
//Window size: The window size is the look-back period and it is a basic setting of ALMA.
//Experienced traders can change this setting according to their preference.
//But if you are using this indicator for the first time, it is recommended to go with the default setting.
//Offset: The offset value is used to tweak the ALMA so that it will be more inclined
//towards responsiveness or smoothness. You can set the offset in decimals between the 0 to1.
//The value of 0.01 makes it smoother, while a setting of 0.99 makes the indicator more responsive.
//Sigma: The sigma is used for the filter. Any value less than 6 makes the indicator
//more focused, whereas the setting of 6 makes the filter large. According to Mr Arnaud,
//a sigma value of 6 is offer good performance.
/// Explain DSS ///
//Parameters
//The adjustable period length can be chosen from 2 to 500.
//The most common settings will have a period length ranging from 5 to 30.
//In addition, the indicator can be smoothed in the interval from 1 to 50.
//Meaningful smoothing values lie in the short-term range.
//Interpretation
//The application of the DSS is comparable with that of the stochastic method.
//Accordingly, values above 70 or 80 must be regarded as overbought and values below 20 or 30 as oversold.
//A rise of the DSS above its center line should be viewed as bullish,
//and a fall of the DSS below its center line as bearish
/// End Of The Code///
As usual they have all the adjustable colors and signals. I hope you enjoy them and leave here below the length of signals that best suit your needs so that we can continue sharing content
Description
One after the other, William Blau and Walter Bressert each presented a version of the Double Smoothed Stochastics. Two exponentially smoothed MAs are used to even out the input values (H, L and C), in a similar way to the well-known stochastic formula.
Parameters
The adjustable period length can be chosen from 2 to 500. The most common settings will have a period length ranging from 5 to 30. In addition, the indicator can be smoothed in the interval from 1 to 50. Meaningful smoothing values lie in the short-term range.
Interpretation
The application of the DSS is comparable with that of the stochastic method. Accordingly, values above 70 or 80 must be regarded as overbought and values below 20 or 30 as oversold. A rise of the DSS above its center line should be viewed as bullish, and a fall of the DSS below its center line as bearish.
/// Quick Explained ALMA ///
//Window size: The window size is the look-back period and it is a basic setting of ALMA.
//Experienced traders can change this setting according to their preference.
//But if you are using this indicator for the first time, it is recommended to go with the default setting.
//Offset: The offset value is used to tweak the ALMA so that it will be more inclined
//towards responsiveness or smoothness. You can set the offset in decimals between the 0 to1.
//The value of 0.01 makes it smoother, while a setting of 0.99 makes the indicator more responsive.
//Sigma: The sigma is used for the filter. Any value less than 6 makes the indicator
//more focused, whereas the setting of 6 makes the filter large. According to Mr Arnaud,
//a sigma value of 6 is offer good performance.
/// Explain DSS ///
//Parameters
//The adjustable period length can be chosen from 2 to 500.
//The most common settings will have a period length ranging from 5 to 30.
//In addition, the indicator can be smoothed in the interval from 1 to 50.
//Meaningful smoothing values lie in the short-term range.
//Interpretation
//The application of the DSS is comparable with that of the stochastic method.
//Accordingly, values above 70 or 80 must be regarded as overbought and values below 20 or 30 as oversold.
//A rise of the DSS above its center line should be viewed as bullish,
//and a fall of the DSS below its center line as bearish
/// End Of The Code///
Skrip sumber terbuka
Dalam semangat sebenar TradingView, pencipta skrip ini telah menjadikannya sumber terbuka supaya pedagang dapat menilai dan mengesahkan kefungsiannya. Terima kasih kepada penulis! Walaupun anda boleh menggunakannya secara percuma, ingat bahawa menerbitkan semula kod ini adalah tertakluk kepada Peraturan Dalaman kami.
Penafian
Maklumat dan penerbitan adalah tidak dimaksudkan untuk menjadi, dan tidak membentuk, nasihat untuk kewangan, pelaburan, perdagangan dan jenis-jenis lain atau cadangan yang dibekalkan atau disahkan oleh TradingView. Baca dengan lebih lanjut di Terma Penggunaan.