PROTECTED SOURCE SCRIPT
Telah dikemas kini SpaceTime Profile Regular SpaceManBTC

SpaceTime Profile Regular SpaceManBTC
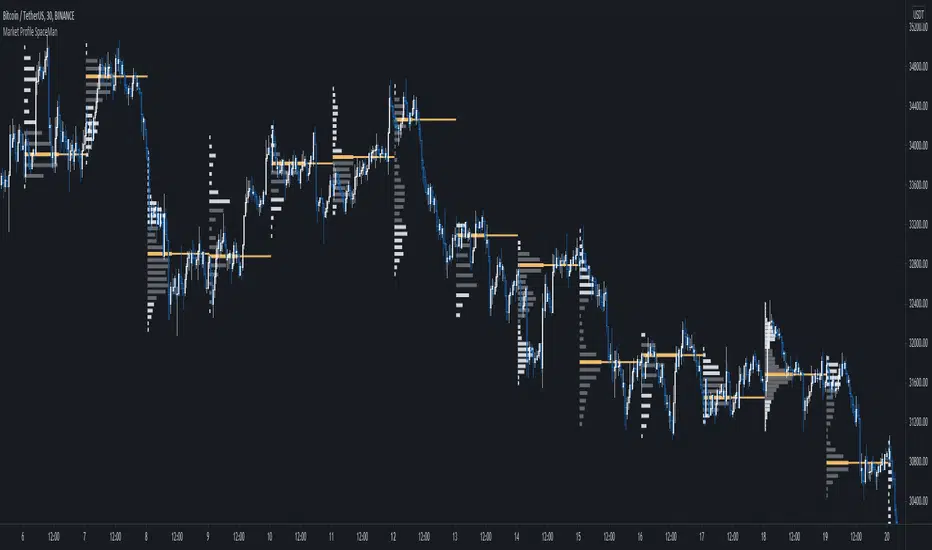
Is a profiling tool for a market session.
Using time and price it calculates the TPO mapping the POC on your chart as well as the general profile.
The tool is useful as it can give you a general idea of how a day traded/is trading based off of its shape.
As well as provides the current developing POC as a reference for potentially a dynamic level of interest.
Value area shading is also including in the release using 68% as my reference of personal choice to represent where
bulk of the market activity occured on a given time frame.
To generate the data the indicator aims to look at the price variations over time of the given session (you can choose this in settings), this will then stack
and overlay on the chart to generate the TPO calculations by mapping 1 to 1 with the price you see on the chart.
This will give you areas of importance such as the POC which can be retested when naked providing a point of interest.
Works similar to volume profile but with no volume calculations only with price and time in mind.
Very useful tool for trend / market analysis by providing this graphical representation of a trading session between buyers and sellers!
Nota Keluaran
Updating Chart to have symbol name.Nota Keluaran
Fixed a coloring error spotted by a user! Thank you for noticing this! Skrip dilindungi
Skrip ini diterbitkan sebagai sumber tertutup. Akan tetapi, anda boleh menggunakannya secara bebas dan tanpa apa-apa had – ketahui lebih di sini.
Penafian
Maklumat dan penerbitan adalah tidak bertujuan, dan tidak membentuk, nasihat atau cadangan kewangan, pelaburan, dagangan atau jenis lain yang diberikan atau disahkan oleh TradingView. Baca lebih dalam Terma Penggunaan.
Skrip dilindungi
Skrip ini diterbitkan sebagai sumber tertutup. Akan tetapi, anda boleh menggunakannya secara bebas dan tanpa apa-apa had – ketahui lebih di sini.
Penafian
Maklumat dan penerbitan adalah tidak bertujuan, dan tidak membentuk, nasihat atau cadangan kewangan, pelaburan, dagangan atau jenis lain yang diberikan atau disahkan oleh TradingView. Baca lebih dalam Terma Penggunaan.