PROTECTED SOURCE SCRIPT
Snapfront Market Clarity Index (MCI) — Lite
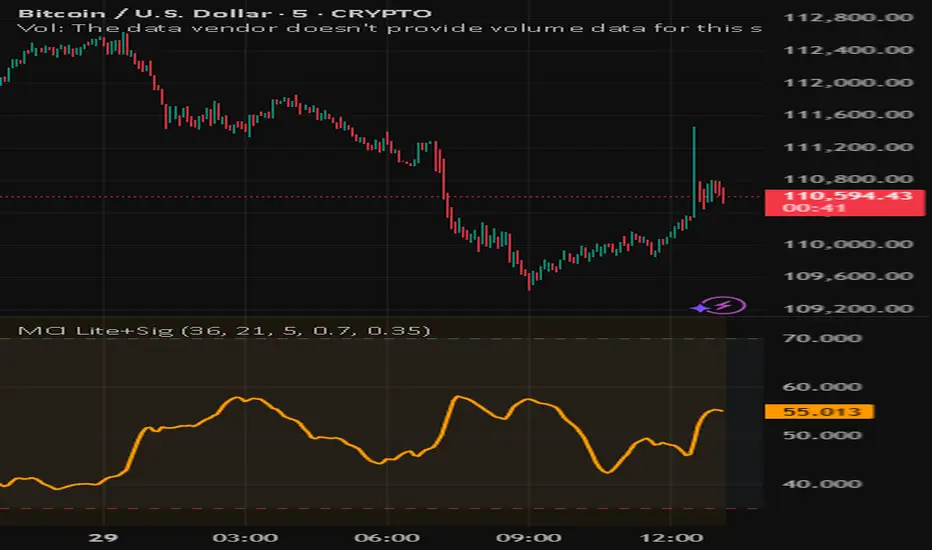
Market Clarity Index (MCI) — Lite + Signals
The Market Clarity Index (MCI) measures trend clarity vs. noise using returns, drift, and volume shock dynamics. Values are normalized through a φ²-based sigmoid for smooth, interpretable signals.
Features:
Clear 0–100 scale (Lite version)
Heatmap background for clarity regimes
Bull/Bear signal arrows with EMA filter
High/Low threshold lines for easy context
Trading Logic:
✅ Bull signal when MCI crosses into the high zone with price above EMA
❌ Bear signal when MCI crosses into the low zone with price below EMA
Use MCI as a trend filter, entry trigger, or market condition gauge across any timeframe or asset.
Skrip dilindungi
Skrip ini diterbitkan sebagai sumber tertutup. Akan tetapi, anda boleh menggunakannya dengan percuma dan tanpa had – ketahui lebih lanjut di sini.
Penafian
Maklumat dan penerbitan adalah tidak dimaksudkan untuk menjadi, dan tidak membentuk, nasihat untuk kewangan, pelaburan, perdagangan dan jenis-jenis lain atau cadangan yang dibekalkan atau disahkan oleh TradingView. Baca dengan lebih lanjut di Terma Penggunaan.