PROTECTED SOURCE SCRIPT
aiTrendview Performance Monitor
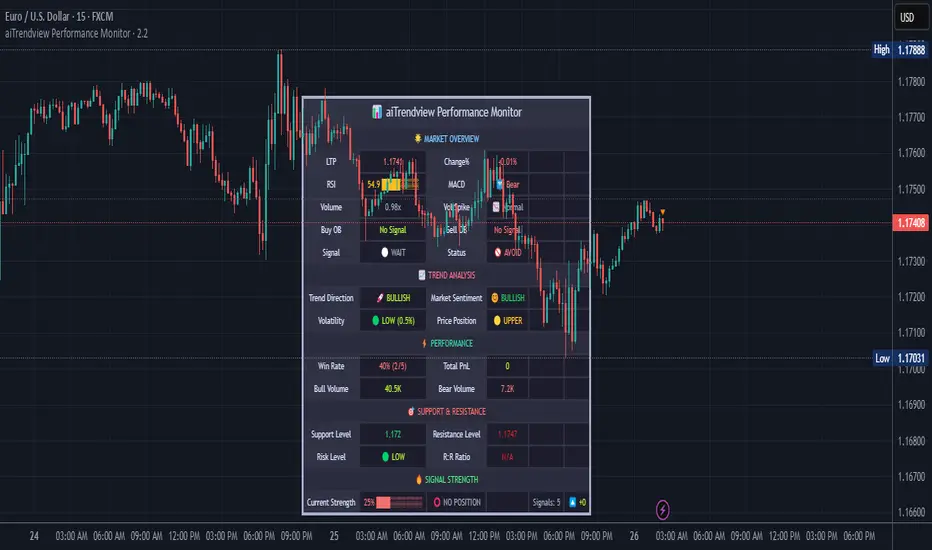
aiTrendview.com Performance Monitor – Study Material
Overview:
This tool is a multi layered TradingView indicator designed to help traders detect high probability trades by combining order block detection, trendline analysis, volume and ATR filters, and dynamic target projection. Below is a step by step guide with essential formulas to use it effectively.
________________________________________
Key Features and How to Use Them:
• Order Block Detection:
The script identifies zones where strong buying or selling occurred.
• You define the number of consecutive candles (periods) to qualify an order block.
• A valid move is detected if
\text{Price Move %} = \frac{|Close_{n} - Close_{1}|}{Close_{n}} \times 100 \geq \text{Threshold}
• Bullish Order Block: a down candle followed by a sequence of bullish candles.
• Bearish Order Block: an up candle followed by a sequence of bearish candles.
• Trendline Logic:
It uses pivots to draw dynamic support and resistance.
• Pivot high and low are calculated over a period (e.g., 10 bars).
• Trendline slope is:
Slope=Pivotnew−PivotoldTimenew−TimeoldSlope = \frac{Pivot_{new} - Pivot_{old}}{Time_{new} - Time_{old}}
• Current resistance or support is extrapolated:
Price=StartPrice+Slope×(CurrentTime−StartTime)Price = StartPrice + Slope \times (CurrentTime - StartTime)
• Volume and ATR Filters:
To avoid weak signals, the script checks for significant volume and volatility.
• Average volume over 20 bars is:
AvgVol=SMA(Volume,20)AvgVol = \text{SMA}(Volume, 20)
A volume spike occurs if:
Volume>AvgVol×VolumeThresholdVolume > AvgVol \times VolumeThreshold
• ATR is calculated over 14 bars. The range filter checks:
(High−Low)>ATR×ATRMultiplier(High - Low) > ATR \times ATRMultiplier
• Signal Generation:
• A bullish signal appears when a valid bullish order block or resistance breakout occurs, confirmed by filters and trend bias (EMA9 > EMA21 > EMA50).
• A bearish signal appears under mirrored conditions with support breakdowns and trend confirmation (EMA9 < EMA21 < EMA50).
• Target Projection:
Once a signal is confirmed, the script projects target and stop loss levels using ATR:
• For a long trade:
TP=High+(ATR×2)TP = High + (ATR \times 2) SL=Low−(ATR×1)SL = Low - (ATR \times 1)
• For a short trade:
TP=Low−(ATR×2)TP = Low - (ATR \times 2) SL=High+(ATR×1)SL = High + (ATR \times 1)
• Trade Management:
When a trade is active, the indicator updates target and stop loss lines dynamically. If price reaches TP, it records a win; if price hits SL, it records a loss.
Win rate is calculated as:
WinRate=WinsSignals×100%WinRate = \frac{\text{Wins}}{\text{Signals}} \times 100\%
• Practical Usage Steps:
• Add the indicator to your chart and configure inputs to match your trading style.
• Wait for a BUY or SELL label on the chart.
• Confirm direction with trend (EMA alignment), momentum (RSI and MACD), and volume conditions.
• Enter trade on the next candle after signal confirmation.
• Set your stop loss and target based on the automatically plotted ATR projections.
• Monitor price action and exit when targets are hit or trend conditions change.
• Alerts:
The script supports alerts for bullish or bearish signals, and for TP or SL hits, so you can automate notifications for active trade management.
________________________________________
Disclaimer:
aiTrendview.com and this tool and the information provided are strictly for educational and research purposes only. They do not constitute financial advice or investment recommendations. Trading involves significant risk, and past performance is not indicative of future results. You are solely responsible for your trading decisions, including risk management, position sizing, and due diligence. Always test any strategy in a demo account before using real capital, and consult with a qualified financial advisor if needed. 📌
Skrip dilindungi
Skrip ini diterbitkan sebagai sumber tertutup. Akan tetapi, anda boleh menggunakannya dengan percuma dan tanpa had – ketahui lebih lanjut di sini.
Penafian
Maklumat dan penerbitan adalah tidak dimaksudkan untuk menjadi, dan tidak membentuk, nasihat untuk kewangan, pelaburan, perdagangan dan jenis-jenis lain atau cadangan yang dibekalkan atau disahkan oleh TradingView. Baca dengan lebih lanjut di Terma Penggunaan.