PROTECTED SOURCE SCRIPT
Fear index by Clarity Charts
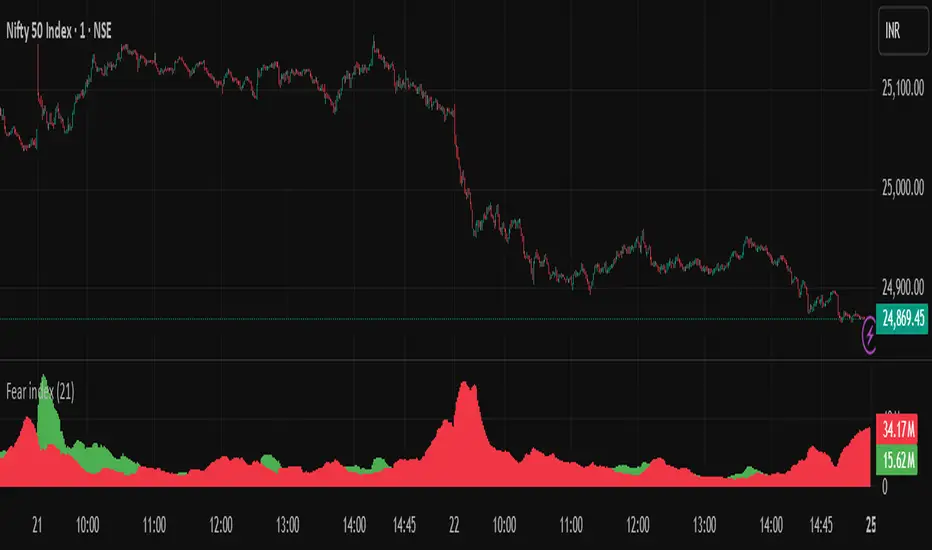
Fear Index – Market Sentiment Strength Meter
The Fear Index is a unique, custom-built indicator designed to visualize market sentiment shifts by highlighting periods of fear (red) and confidence (green) directly on your chart. Unlike traditional oscillators, this tool combines price action dynamics with volume intensity to detect when participants are aggressively selling or confidently buying.
How to Use:
Red spikes indicate rising fear, panic, or heavy selling pressure – potential trend reversals or breakdown signals.
Green spikes highlight confidence, strength, or accumulation – signaling possible recovery or continuation.
Best used with trend analysis, support/resistance zones, and volume confirmation for high-probability setups.
Why this is different:
Not a copy of any existing indicator – this is a brand-new formula.
Helps you anticipate market mood before major price swings.
Works across multiple timeframes and instruments (indices, stocks, crypto, forex).
Pro Tip: Combine this with EMA/Trend filters for powerful trade entries and exits.
Support the Work
If you find this indicator valuable, please boost by like, comment, and share it so I can continue creating more powerful and innovative tools for traders like you. Your support keeps this research alive!
Skrip dilindungi
Skrip ini diterbitkan sebagai sumber tertutup. Akan tetapi, anda boleh menggunakannya dengan percuma dan tanpa had – ketahui lebih lanjut di sini.
Penafian
Maklumat dan penerbitan adalah tidak dimaksudkan untuk menjadi, dan tidak membentuk, nasihat untuk kewangan, pelaburan, perdagangan dan jenis-jenis lain atau cadangan yang dibekalkan atau disahkan oleh TradingView. Baca dengan lebih lanjut di Terma Penggunaan.