OPEN-SOURCE SCRIPT
Ehlers Universal Oscillator [LazyBear]
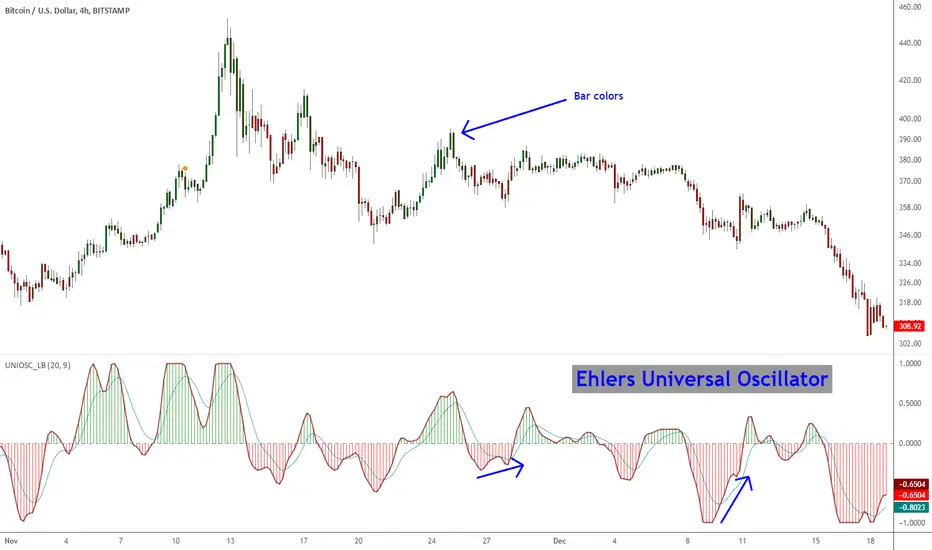
Universal Oscillator by Mr. Ehlers is an evolution of his SuperSmoother filter. The new indicator follows the swings in price without introducing extra delay.
It is controlled through one single input – the band edge – which basically is frequency. The smaller it is set, the less lag there is, but you may see lot of whipsaws. Built-in automatic gain control normalizes the output to vary between the range of -1 to +1.
Mr. Ehlers suggests a straightforward system:
- Buy when long-term Universal Oscillator crosses above zero
- Sell when long-term Universal Oscillator crosses below zero
I have added options to draw a signal line, histogram and bar coloring. Bar coloring, if enabled, is done using the histogram color, but you can change it easily to signal_cross by uncommenting a line (check the source).
More info:
[S&C 2015/01] Whiter is Brighter - Ehlers
List of my other indicators:
- GDoc: docs.google.com/document/d/15AGCufJZ8CIUvwFJ9W-IKns88gkWOKBCvByMEvm5MLo/edit?usp=sharing
- Chart: tradingview.com/v/4IneGo8h/
Skrip sumber terbuka
Dalam semangat sebenar TradingView, pencipta skrip ini telah menjadikannya sumber terbuka supaya pedagang dapat menilai dan mengesahkan kefungsiannya. Terima kasih kepada penulis! Walaupun anda boleh menggunakannya secara percuma, ingat bahawa menerbitkan semula kod ini adalah tertakluk kepada Peraturan Dalaman kami.
List of my free indicators: bit.ly/1LQaPK8
List of my indicators at Appstore: blog.tradingview.com/?p=970
List of my indicators at Appstore: blog.tradingview.com/?p=970
Penafian
Maklumat dan penerbitan adalah tidak dimaksudkan untuk menjadi, dan tidak membentuk, nasihat untuk kewangan, pelaburan, perdagangan dan jenis-jenis lain atau cadangan yang dibekalkan atau disahkan oleh TradingView. Baca dengan lebih lanjut di Terma Penggunaan.