OPEN-SOURCE SCRIPT
Stochastic Distance Indicator [CC]
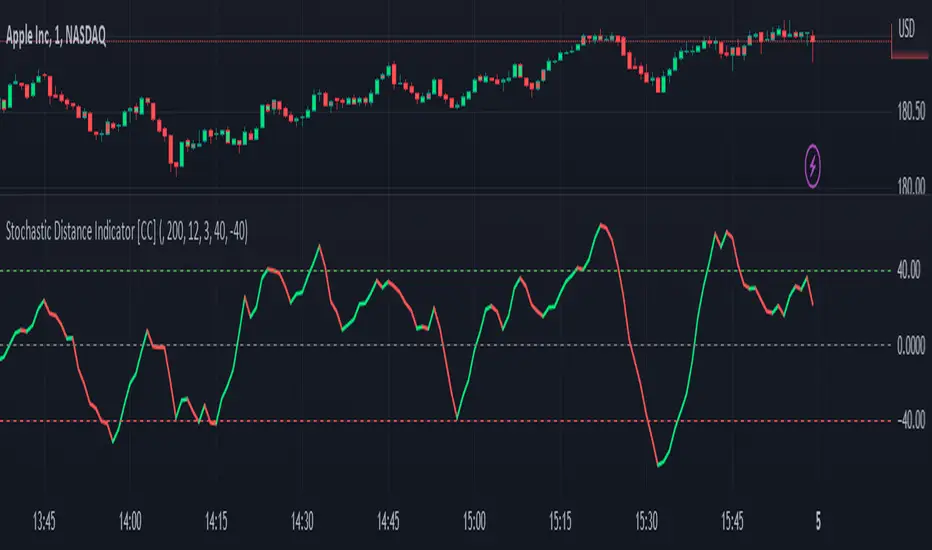
The Stochastic Distance Indicator was created by Vitali Apirine (Stocks and Commodities Jun 2023 pgs 16-21), and this is a new method that measures the absolute distance between a price and its highest and lowest values over a long period. It uses the stochastic formula to create an oscillator using this distance value and smooths the value. Obviously, there is a lag in signals due to the lookback periods, but it does a good job of staying above the midline when the stock is in a strong uptrend and vice versa. Of course, I'm open to suggestions, but I'm deciding to create buy and sell signals based on comparing the unsmoothed and smoothed values. Buy when the line turns green and sell when it turns red.
Let me know if there are any other indicators you would like to see me publish!
Let me know if there are any other indicators you would like to see me publish!
Skrip sumber terbuka
Dalam semangat sebenar TradingView, pencipta skrip ini telah menjadikannya sumber terbuka supaya pedagang dapat menilai dan mengesahkan kefungsiannya. Terima kasih kepada penulis! Walaupun anda boleh menggunakannya secara percuma, ingat bahawa menerbitkan semula kod ini adalah tertakluk kepada Peraturan Dalaman kami.
I created the largest stock indicator library:
github.com/ooples/
Custom Indicator Requests:
forms.gle/ouMffZR3dQ8bSJQG7
Tips are appreciated:
paypal.me/cheatcountry
patreon.com/cheatcountry
github.com/ooples/
Custom Indicator Requests:
forms.gle/ouMffZR3dQ8bSJQG7
Tips are appreciated:
paypal.me/cheatcountry
patreon.com/cheatcountry
Penafian
Maklumat dan penerbitan adalah tidak dimaksudkan untuk menjadi, dan tidak membentuk, nasihat untuk kewangan, pelaburan, perdagangan dan jenis-jenis lain atau cadangan yang dibekalkan atau disahkan oleh TradingView. Baca dengan lebih lanjut di Terma Penggunaan.