OPEN-SOURCE SCRIPT
Telah dikemas kini Elite Trend Fusion
This indicator combines multiple technical analysis tools to assist traders in identifying trends, support/resistance levels, and potential trading opportunities. Developed by IQ-TRADER with contributions to the Alpha Section by KivancOzbilgic, this script overlays the following components on your chart:
EMA1: A customizable Exponential Moving Average for short-term trend analysis.
SMA Cluster (50, 100, 200): Simple Moving Averages on daily timeframes to identify long-term trends and key support/resistance zones.
Anchored VWAP x2 (VWAPCVD & VWAPARZ): Two Volume Weighted Average Price lines anchored to user-defined dates, providing insights into price levels relative to volume from specific points in time.
AlphaTrend: A custom trend-following indicator based on ATR and MFI, helping to gauge market direction and volatility.
Usage InstructionsInstallation:
Copy and paste the script into the Pine Script editor on TradingView, then add it to your chart.
Customization:Adjust the periods for EMA, SMA50, SMA100, and SMA200 under the "Inputs" tab.
Set the anchor dates for VWAPCVD and VWAPARZ to analyze specific historical periods.
Enable or disable individual components (EMA1, SMA50, SMA100, SMA200, VWAPCVD, VWAPARZ, AlphaTrend) and toggle labels via the settings.
Customize colors and line thickness to suit your preferences.
Modify the AlphaTrend multiplier and period for tailored sensitivity.
Interpretation:
Use the EMA1 for short-term momentum and crossovers with SMAs.
Monitor SMA crossovers (e.g., SMA50 crossing SMA200) for trend changes.
The Anchored VWAPs act as dynamic support/resistance levels based on the selected anchor dates.
AlphaTrend provides a visual guide for trend direction; use it alongside other indicators for confirmation.
Labels on the last bar show the current value and percentage distance from the price for each enabled indicator.
Pine Screener Module Usage:
Add this indicator to the Pine Screener to filter stocks, forex pairs, or other instruments based on the calculated distances (in percentage) between the close price and SMA50, SMA100, SMA200, VWAPCVD, and VWAPARZ.
In the Screener, use the "SMA50 Distance (%)", "SMA100 Distance (%)", "SMA200 Distance (%)", "VWAPCVD Distance (%)", and "VWAPARZ Distance (%)" columns to identify overbought/oversold conditions or potential reversal points.
Example filters: Set conditions like "SMA50 Distance (%) > 5" to find stocks trading significantly above the 50-day SMA, or "VWAPCVD Distance (%) < -2" to spot assets below the anchored VWAP, indicating potential support levels.
Combine multiple conditions (e.g., SMA50 Distance (%) > 5 AND AlphaTrend > previous AlphaTrend) to refine your scan for bullish trends.
Note: Ensure the indicator is applied to the chart or screener with the desired timeframe for accurate results.
Notes
This is an overlay indicator, meaning it plots directly on the price chart.
The script uses daily SMA calculations for consistency across timeframes.
Labels appear only on the last bar and are customizable.
This tool is for educational and informational purposes only. Trading involves risks, and it is recommended to consult a financial advisor before making decisions.
The script is credited to IQ-TRADER with acknowledgment to KivancOzbilgic for the Alpha Section contribution, adhering to intellectual property guidelines.
No Financial Advice: The description explicitly states that the indicator is for educational use and not financial advice, complying with TradingView's policy against promoting trading signals as guarantees.
Clear Usage: Step-by-step instructions are provided to ensure users can apply the indicator effectively, including screener usage.
No External Links or Promotions: No external links or promotional content is included, aligning with platform rules.
Nota Keluaran
Elite Trend Fusion is a multi-component overlay indicator designed to help traders identify trends, support/resistance zones, and potential trading opportunities. Developed by IQ-TRADER, with contributions to the AlphaTrend module by KivancOzbilgic, this tool integrates several proven techniques into a unified framework for enhanced market analysis.🔍 Key Components
- EMA1: A customizable Exponential Moving Average for short-term momentum tracking.
When using this indicator in the Pine Screener, set the EMA period to 1 to reflect the current price accurately. This ensures that the EMA1 column behaves as a real-time price proxy, especially useful for short-term scans.
- SMA Cluster (50, 100, 200): Daily SMAs to highlight long-term trend direction and key support/resistance levels.
- Anchored VWAPs (VWAPCVD & VWAPARZ): Volume-weighted average price lines anchored to user-defined dates, offering volume-contextual price zones.
- AlphaTrend: A custom trend-following indicator based on ATR and MFI, designed to visualize market direction and volatility.
🧠 Why These Components Work Together
This fusion was built to provide a layered view of market structure. While SMAs offer static trend zones, EMA1 captures short-term momentum shifts. Anchored VWAPs add volume-weighted context to price action from specific historical points. AlphaTrend complements the system by visualizing volatility-adjusted trend strength. Together, these elements form a robust framework for identifying confluence zones and actionable signals.
⚙️ Customization & Settings
- Adjust periods for EMA1, SMA50/100/200, and AlphaTrend via the Inputs tab.
- Set anchor dates for VWAPCVD and VWAPARZ to analyze specific historical volume zones.
- Enable/disable each module independently (EMA1, SMAs, VWAPs, AlphaTrend).
- Customize colors, line thickness, and label visibility to suit your charting style.
- Modify AlphaTrend’s multiplier and period for tailored sensitivity.
📊 Interpretation Guide
- EMA1 vs SMAs: Use crossovers to detect short-term momentum shifts within long-term trends.
- SMA Crossovers: Watch for SMA50 crossing SMA200 as a classic trend reversal signal.
- Anchored VWAPs: Identify dynamic support/resistance based on volume-weighted price zones.
- AlphaTrend: Use as a visual confirmation of trend direction and strength.
- Last Bar Labels: Display current values and percentage distance from price for each active component.
🔎 Screener Integration
Elite Trend Fusion includes a Pine Screener module to filter assets based on proximity to key levels:
- Columns:
- SMA50/100/200 Distance (%)
- VWAPCVD/VWAPARZ Distance (%)
- Example Filters:
- SMA50 Distance (%) > 5 → Assets trading well above SMA50
- VWAPCVD Distance (%) < -2 → Assets below anchored VWAP, potential support
- Combine with AlphaTrend > previous AlphaTrend for bullish setups
Ensure the indicator is applied to the chart or screener with your desired timeframe for accurate results.
📋 Chart Simplicity
The published chart includes only the outputs of this indicator. No external indicators or unexplained drawings are present. All visual elements—plots, signal lines, and labels—are generated by the script itself and can be toggled via settings.
🧹 Label Management Enhancement
To ensure chart clarity and prevent visual clutter, the indicator includes a label cleanup mechanism. Labels displaying indicator values and percentage distances are shown only on the latest bar. Previous labels are automatically removed when a new bar forms, maintaining a clean and focused chart view. This enhancement improves usability and aligns with TradingView’s publishing standards for visual simplicity.
🧠 Notes for Traders
- Timeframe Flexibility:
The indicator adapts to various timeframes. SMA calculations use daily data for consistency.
- Risk Management:
Always combine visual signals with proper stop-loss and position sizing. This tool is not a substitute for disciplined trading.
- Educational Purpose:
This indicator is intended for informational and educational use only. It does not provide financial advice or guaranteed outcomes.
🧾 Compliance & Attribution
- Script authored by IQ-TRADER, with acknowledgment to KivancOzbilgic for the AlphaTrend module.
- No external links or promotional content included.
- Fully aligned with TradingView’s publishing guidelines and intellectual property policies.
Nota Keluaran
Improvement Description for Elite Trend Fusion Indicator Upgrade
This upgrade introduces several enhancements to the Elite Trend Fusion indicator, focusing on dynamic VWAP anchoring, customizable table displays, and improved user control for better trend analysis and visualization:
Dynamic VWAP Anchoring: Users can now automatically anchor two VWAP lines to the highest (H) and lowest (L) bars within a user-defined lookback period (default: 100 bars). This allows for real-time calculation of VWAP values starting from these dynamic high/low points, providing more adaptive support/resistance levels based on recent price action.
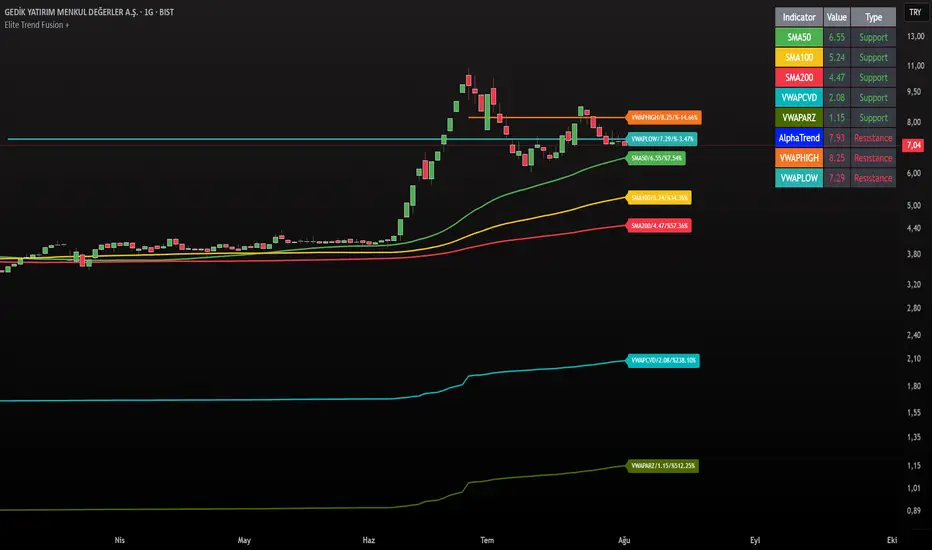
Support/Resistance Table Enhancements: All plotted indicators (including SMAs, VWAPs, AlphaTrend, and the new dynamic VWAPs) now have their positions relative to the current price automatically classified and displayed in the table as "Support," "Resistance"
Customizable Table Rows: Users gain granular control over the table content, with individual toggle options to show or hide specific indicators (e.g., SMA50, VWAP High Anchor). This reduces clutter and allows tailoring the table to focus on preferred metrics.
Flexible Table Positioning: A new input option lets users select the table's location on the chart, including positions like Top Left, Middle Center, Bottom Right, and more, for optimized screen real estate and usability.
These features empower traders to create a more personalized and efficient charting experience, adapting to various market conditions while maintaining the indicator's core fusion of trends, moving averages, and volume-weighted insights.
Skrip sumber terbuka
Dalam semangat TradingView sebenar, pencipta skrip ini telah menjadikannya sumber terbuka, jadi pedagang boleh menilai dan mengesahkan kefungsiannya. Terima kasih kepada penulis! Walaupuan anda boleh menggunakan secara percuma, ingat bahawa penerbitan semula kod ini tertakluk kepada Peraturan Dalaman.
Penafian
Maklumat dan penerbitan adalah tidak bertujuan, dan tidak membentuk, nasihat atau cadangan kewangan, pelaburan, dagangan atau jenis lain yang diberikan atau disahkan oleh TradingView. Baca lebih dalam Terma Penggunaan.