OPEN-SOURCE SCRIPT
Telah dikemas kini Median Deviation Suite [InvestorUnknown]
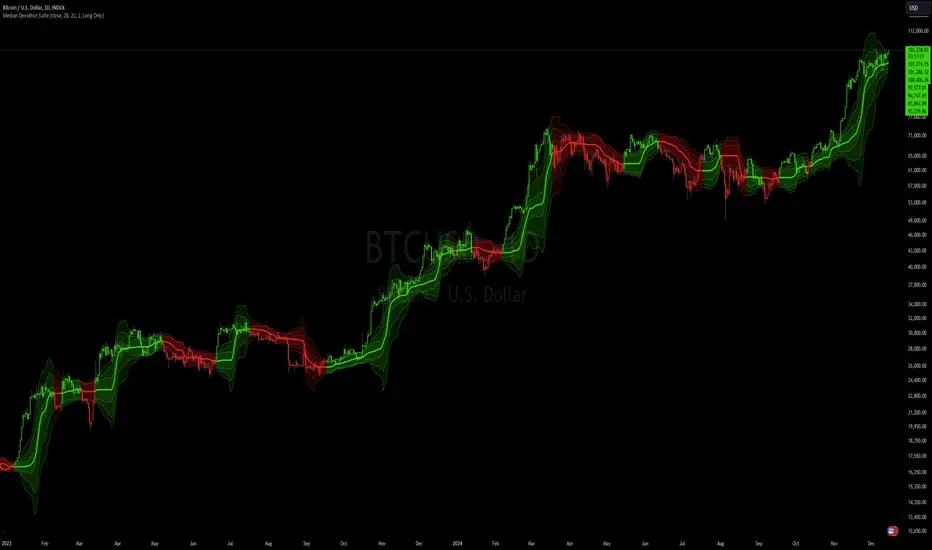
The Median Deviation Suite uses a median-based baseline derived from a Double Exponential Moving Average (DEMA) and layers multiple deviation measures around it. By comparing price to these deviation-based ranges, it attempts to identify trends and potential turning points in the market. The indicator also incorporates several deviation types—Average Absolute Deviation (AAD), Median Absolute Deviation (MAD), Standard Deviation (STDEV), and Average True Range (ATR)—allowing traders to visualize different forms of volatility and dispersion. Users should calibrate the settings to suit their specific trading approach, as the default values are not optimized.

Core Components
Median of a DEMA:
The foundation of the indicator is a Median applied to the 7-day DEMA (Double Exponential Moving Average). DEMA aims to reduce lag compared to simple or exponential moving averages. By then taking a median over median_len periods of the DEMA values, the indicator creates a robust and stable central tendency line.
Pine Script®
Multiple Deviation Measures:
Around this median, the indicator calculates several measures of dispersion:
Each measure is multiplied by a user-defined multiplier (dev_mul) to scale the width of the bands.
Pine Script®
Deviation-Based Bands:
The indicator creates multiple upper and lower lines based on each deviation type. For example, using MAD:
Pine Script®
Similar calculations are done for AAD, STDEV, ATR, and the average of these deviations. The indicator then determines the overall upper and lower boundaries by combining these lines:
Pine Script®
This creates a layered structure of volatility envelopes. Traders can observe which layers price interacts with to gauge trend strength.
Determining Trend
The indicator generates trend signals by assessing where price stands relative to these deviation-based lines. It assigns a trend score by summing individual signals from each deviation measure. For instance, if price crosses above the MAD-based upper line, it contributes a bullish point; crossing below an ATR-based lower line contributes a bearish point.
When the aggregated trend score crosses above zero, it suggests a shift towards a bullish environment; crossing below zero indicates a bearish bias.
Pine Script®
Practical Usage and Calibration
Default settings are not optimized: The given parameters serve as a starting point for demonstration. Users should adjust:
This flexibility allows the trader to tailor the indicator for various markets (stocks, forex, crypto) and time frames.
Backtesting and Performance Metrics
The code integrates with a backtesting library that allows traders to:

Disclaimer
Core Components
Median of a DEMA:
The foundation of the indicator is a Median applied to the 7-day DEMA (Double Exponential Moving Average). DEMA aims to reduce lag compared to simple or exponential moving averages. By then taking a median over median_len periods of the DEMA values, the indicator creates a robust and stable central tendency line.
float dema = ta.dema(src, 7)
float median = ta.median(dema, median_len)
Multiple Deviation Measures:
Around this median, the indicator calculates several measures of dispersion:
- ATR (Average True Range): A popular volatility measure.
- STDEV (Standard Deviation): Measures the spread of price data from its mean.
- MAD (Median Absolute Deviation): A robust measure of variability less influenced by outliers.
- AAD (Average Absolute Deviation): Similar to MAD, but uses the mean absolute deviation instead of median.
- Average of Deviations (avg_dev): The average of the above four measures (ATR, STDEV, MAD, AAD), providing a combined sense of volatility.
Each measure is multiplied by a user-defined multiplier (dev_mul) to scale the width of the bands.
aad = f_aad(src, dev_len, median) * dev_mul
mad = f_mad(src, dev_len, median) * dev_mul
stdev = ta.stdev(src, dev_len) * dev_mul
atr = ta.atr(dev_len) * dev_mul
avg_dev = math.avg(aad, mad, stdev, atr)
Deviation-Based Bands:
The indicator creates multiple upper and lower lines based on each deviation type. For example, using MAD:
float mad_p = median + mad // already multiplied by dev_mul
float mad_m = median - mad
Similar calculations are done for AAD, STDEV, ATR, and the average of these deviations. The indicator then determines the overall upper and lower boundaries by combining these lines:
float upper = f_max4(aad_p, mad_p, stdev_p, atr_p)
float lower = f_min4(aad_m, mad_m, stdev_m, atr_m)
float upper2 = f_min4(aad_p, mad_p, stdev_p, atr_p)
float lower2 = f_max4(aad_m, mad_m, stdev_m, atr_m)
This creates a layered structure of volatility envelopes. Traders can observe which layers price interacts with to gauge trend strength.
Determining Trend
The indicator generates trend signals by assessing where price stands relative to these deviation-based lines. It assigns a trend score by summing individual signals from each deviation measure. For instance, if price crosses above the MAD-based upper line, it contributes a bullish point; crossing below an ATR-based lower line contributes a bearish point.
When the aggregated trend score crosses above zero, it suggests a shift towards a bullish environment; crossing below zero indicates a bearish bias.
// Define Trend scores
var int aad_t = 0
if ta.crossover(src, aad_p)
aad_t := 1
if ta.crossunder(src, aad_m)
aad_t := -1
var int mad_t = 0
if ta.crossover(src, mad_p)
mad_t := 1
if ta.crossunder(src, mad_m)
mad_t := -1
var int stdev_t = 0
if ta.crossover(src, stdev_p)
stdev_t := 1
if ta.crossunder(src, stdev_m)
stdev_t := -1
var int atr_t = 0
if ta.crossover(src, atr_p)
atr_t := 1
if ta.crossunder(src, atr_m)
atr_t := -1
var int adev_t = 0
if ta.crossover(src, adev_p)
adev_t := 1
if ta.crossunder(src, adev_m)
adev_t := -1
int upper_t = src > upper ? 3 : 0
int lower_t = src < lower ? 0 : -3
int upper2_t = src > upper2 ? 1 : 0
int lower2_t = src < lower2 ? 0 : -1
float trend = aad_t + mad_t + stdev_t + atr_t + adev_t + upper_t + lower_t + upper2_t + lower2_t
var float sig = 0
if ta.crossover(trend, 0)
sig := 1
else if ta.crossunder(trend, 0)
sig := -1
Practical Usage and Calibration
Default settings are not optimized: The given parameters serve as a starting point for demonstration. Users should adjust:
- median_len: Affects how smooth and lagging the median of the DEMA is.
- dev_len and dev_mul: Influence the sensitivity of the deviation measures. Larger multipliers widen the bands, potentially reducing false signals but introducing more lag. Smaller multipliers tighten the bands, producing quicker signals but potentially more whipsaws.
This flexibility allows the trader to tailor the indicator for various markets (stocks, forex, crypto) and time frames.
Backtesting and Performance Metrics
The code integrates with a backtesting library that allows traders to:
- Evaluate the strategy historically
- Compare the indicator’s signals with a simple buy-and-hold approach
- Generate performance metrics (e.g., mean returns, Sharpe Ratio, Sortino Ratio) to assess historical effectiveness.
Disclaimer
- No guaranteed results: Historical performance does not guarantee future outcomes. Market conditions can vary widely.
- User responsibility: Traders should combine this indicator with other forms of analysis, appropriate risk management, and careful calibration of parameters.
Nota Keluaran
Updated the inputs:- added option to use raw median instead of median of 7 bar DEMA
- added display = display.none for signals input
Skrip sumber terbuka
Dalam semangat TradingView sebenar, pencipta skrip ini telah menjadikannya sumber terbuka, jadi pedagang boleh menilai dan mengesahkan kefungsiannya. Terima kasih kepada penulis! Walaupuan anda boleh menggunakan secara percuma, ingat bahawa penerbitan semula kod ini tertakluk kepada Peraturan Dalaman.
Penafian
Maklumat dan penerbitan adalah tidak bertujuan, dan tidak membentuk, nasihat atau cadangan kewangan, pelaburan, dagangan atau jenis lain yang diberikan atau disahkan oleh TradingView. Baca lebih dalam Terma Penggunaan.