PROTECTED SOURCE SCRIPT
Order Book Pressure Index (OBPI)
Overview
The Order Book Pressure Index (OBPI) is a custom technical indicator designed to provide traders with a real-time approximation of market pressure by analyzing buying and selling volumes. Unlike traditional indicators that rely heavily on historical price data, the OBPI focuses on current price movements and volume dynamics to offer a more responsive tool for detecting potential market shifts.
Key Features
How It Works
How to Use
1. Indicator Settings
2. Interpreting the Signals
3. Trading Strategies
Best Practices
Limitations
Conclusion
The Order Book Pressure Index (OBPI) offers traders a unique perspective by focusing on current price movements and volume. Its ability to filter false signals and incorporate multi-timeframe analysis makes it a valuable addition to any trading strategy. Remember to use it in conjunction with other analytical methods and always practice prudent risk management.
Disclaimer: Trading involves significant risk. The OBPI indicator is a tool to aid decision-making and does not guarantee profitable trades. Perform your own analysis and consider consulting a financial advisor before making trading decisions.
The Order Book Pressure Index (OBPI) is a custom technical indicator designed to provide traders with a real-time approximation of market pressure by analyzing buying and selling volumes. Unlike traditional indicators that rely heavily on historical price data, the OBPI focuses on current price movements and volume dynamics to offer a more responsive tool for detecting potential market shifts.
Key Features
- []Approximation of Order Book Pressure: Estimates market pressure by calculating the cumulative delta volume based on price movements and corresponding volumes. []False Signal Filtering: Incorporates threshold levels and moving averages to reduce market noise and minimize false trading signals. []Multi-Timeframe Analysis: Allows selection of multiple higher timeframes for signal confirmation, enhancing signal reliability. []Customizable Parameters: Offers adjustable settings for thresholds, moving average periods, and the number of bars used in calculations.
How It Works
- []Volume Direction Calculation:
- []Determines the price direction for each bar:
- []Bullish: Closing price > Opening price; volume attributed to buying pressure. []Bearish: Closing price < Opening price; volume attributed to selling pressure.
- []Computes the difference between buying and selling volumes to obtain the delta volume for each bar.
- []Calculates the cumulative sum of delta volumes over a specified number of bars (user-defined), focusing on recent market activity.
- []Applies a moving average to the cumulative delta volume to smooth out short-term fluctuations and highlight underlying trends.
- []Threshold Levels: User-defined thresholds identify significant changes in market pressure. []Buy Signal: Triggered when the cumulative delta volume crosses above the positive threshold and is above its moving average. []Sell Signal: Triggered when the cumulative delta volume crosses below the negative threshold and is below its moving average.
- []Timeframe Selection: Traders can select multiple higher timeframes (e.g., 15 min, 30 min, 1 hr, 4 hr) via checkboxes. []Signal Aggregation: The indicator aggregates signals from the selected timeframes. []Final Signal Generation: A buy or sell signal is generated only if it is present on the current timeframe and at least one of the selected higher timeframes.
- []Determines the price direction for each bar:
How to Use
1. Indicator Settings
- []Max Bars:
- []Sets the maximum number of bars for cumulative delta volume calculation. []A smaller number increases responsiveness by focusing on recent activity.
- []Adjusts the period for the moving average applied to the cumulative delta volume. []A shorter period increases sensitivity; a longer period smooths out noise.
- []Defines the minimum delta volume required to generate a signal. []Higher thresholds filter out minor fluctuations.
- []Use the checkboxes to select higher timeframes for multi-timeframe analysis. []Available timeframes include 15 min, 30 min, 1 hr, and 4 hr.
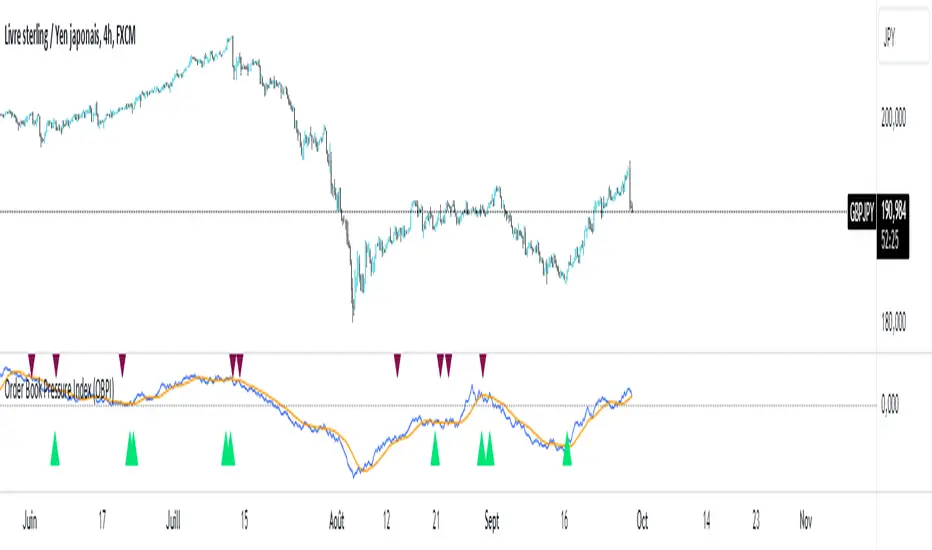
2. Interpreting the Signals
- []Buy Signal (Green Triangle Up):
- []Indicates potential bullish market pressure. []Consider entering long positions when the signal appears.
- []Indicates potential bearish market pressure. []Consider entering short positions or exiting long positions when the signal appears.
- []For higher reliability, ensure that the signal aligns across multiple timeframes.
- The signal is stronger when confirmed by selected higher timeframes.
3. Trading Strategies
- []Trend Following:
- []Use the indicator to identify and follow prevailing market trends. []Enter trades in the direction of the cumulative delta volume.
- []Look for divergences between price movements and the OBPI to anticipate potential market reversals.
- []Always implement appropriate stop-loss and take-profit levels. []Combine the OBPI with sound risk management practices.
Best Practices
- []Combine with Other Indicators:
- []Enhance signal reliability by using the OBPI alongside indicators like RSI, MACD, or support and resistance levels.
- []Test different settings in a demo account to find optimal parameters for your trading style and the specific asset.
- []Be mindful of market volatility and liquidity, as extreme conditions can affect indicator performance.
- []Conduct thorough backtesting over historical data before applying the indicator to live trading.
Limitations
- []Approximation:
- []The OBPI provides an approximation of market pressure and does not access actual order book data.
- []Signals from higher timeframes may lag, affecting the timeliness of combined signals.
- []Multi-timeframe features increase complexity and may impact performance on some platforms.
Conclusion
The Order Book Pressure Index (OBPI) offers traders a unique perspective by focusing on current price movements and volume. Its ability to filter false signals and incorporate multi-timeframe analysis makes it a valuable addition to any trading strategy. Remember to use it in conjunction with other analytical methods and always practice prudent risk management.
Disclaimer: Trading involves significant risk. The OBPI indicator is a tool to aid decision-making and does not guarantee profitable trades. Perform your own analysis and consider consulting a financial advisor before making trading decisions.
Skrip dilindungi
Skrip ini diterbitkan sebagai sumber tertutup. Akan tetapi, anda boleh menggunakannya secara bebas dan tanpa apa-apa had – ketahui lebih di sini.
Penafian
Maklumat dan penerbitan adalah tidak bertujuan, dan tidak membentuk, nasihat atau cadangan kewangan, pelaburan, dagangan atau jenis lain yang diberikan atau disahkan oleh TradingView. Baca lebih dalam Terma Penggunaan.