PROTECTED SOURCE SCRIPT
TrendPilot AI v2 — Smart ATR Indicator with Zones
TrendPilot AI v2 is a smart price-action and ATR-based trading system designed for swing and position traders. It combines trend-following logic with adaptive price zones to help users identify high-probability Buy and Sell opportunities — along with intelligent re-entry points, weak signal detection, and visual structure zones.
🔧 Core Features:
✅ ATR-based Buy/Sell signals with confirmation logic
✅ Dynamic 99 EMA Channel for trend context
✅ Re-entry triangles for stacking or retracing setups
✅ 150 EMA Weak Signal Detection for early trend warnings
✅ 🧭 Price Action Zones (Premium, Equilibrium, Discount)
✅ Visual alerts via triangles, labels, and color-coded logic
✅ Designed for 15m, 1H, and 4H charts — also useful on Daily
🧠 How It Works (Logic Breakdown)
1️⃣ Trend Direction — EMA Channel Logic
A 99 EMA Channel determines the dominant market bias.
If price is above the channel → trend is Bullish → Buy signals are valid
If price is below the channel → trend is Bearish → Sell signals are valid
2️⃣ Buy/Sell Signals — ATR Trailing Logic
The system uses custom ATR trailing logic to detect when price momentum shifts.
When a breakout aligns with trend direction, a Buy or Sell label appears.
These are designed to capture the main trend leg or reversal zone.
3️⃣ Re-Entry Signals — Triangle Visual Cues
During a confirmed trend, if price retraces to the EMA channel, a small triangle is shown:
🔼 Green triangle: Buy re-entry during bullish trend
🔽 Red triangle: Sell re-entry during bearish trend
These are not new signals but continuation cues for advanced traders.
4️⃣ Weak Signal Detection — 150 EMA Logic
A secondary 150 EMA helps detect possible trend exhaustion.
If price dips below 150 EMA during a bullish run, an orange triangle appears (⚠️ caution).
If price rises above 150 EMA during a bearish run, a blue triangle appears.
This signals potential weakening of the active trend.
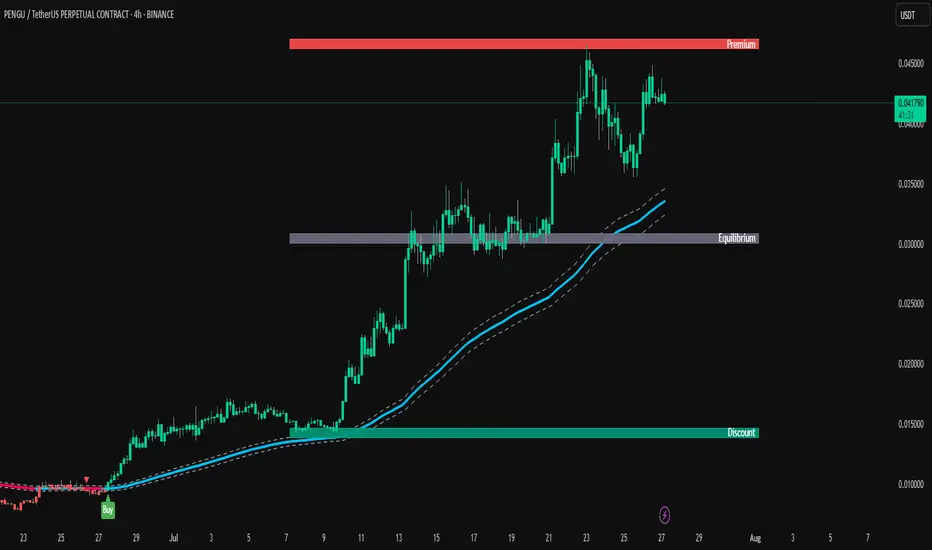
5️⃣ Price Zones — Premium, Equilibrium, Discount
TrendPilot AI v2 draws 3 smart price zones based on ATR & market structure:
🟥 Premium Zone (Top) → Overbought area, caution for long trades
🟨 Equilibrium Zone (Middle) → Fair value, consolidation possible
🟩 Discount Zone (Bottom) → Oversold, better long entries
These zones help filter signals and avoid entries in risky areas.
Example: Avoid Buy signals inside Premium zone.
🧪 Suggested Use:
⚠️ Note for Users:
This script is not repainting. All signals are plotted with stable logic.
Past performance does not guarantee future results — always backtest first.
Script does not contain financial advice — use at your own discretion.
🔧 Core Features:
✅ ATR-based Buy/Sell signals with confirmation logic
✅ Dynamic 99 EMA Channel for trend context
✅ Re-entry triangles for stacking or retracing setups
✅ 150 EMA Weak Signal Detection for early trend warnings
✅ 🧭 Price Action Zones (Premium, Equilibrium, Discount)
✅ Visual alerts via triangles, labels, and color-coded logic
✅ Designed for 15m, 1H, and 4H charts — also useful on Daily
🧠 How It Works (Logic Breakdown)
1️⃣ Trend Direction — EMA Channel Logic
A 99 EMA Channel determines the dominant market bias.
If price is above the channel → trend is Bullish → Buy signals are valid
If price is below the channel → trend is Bearish → Sell signals are valid
2️⃣ Buy/Sell Signals — ATR Trailing Logic
The system uses custom ATR trailing logic to detect when price momentum shifts.
When a breakout aligns with trend direction, a Buy or Sell label appears.
These are designed to capture the main trend leg or reversal zone.
3️⃣ Re-Entry Signals — Triangle Visual Cues
During a confirmed trend, if price retraces to the EMA channel, a small triangle is shown:
🔼 Green triangle: Buy re-entry during bullish trend
🔽 Red triangle: Sell re-entry during bearish trend
These are not new signals but continuation cues for advanced traders.
4️⃣ Weak Signal Detection — 150 EMA Logic
A secondary 150 EMA helps detect possible trend exhaustion.
If price dips below 150 EMA during a bullish run, an orange triangle appears (⚠️ caution).
If price rises above 150 EMA during a bearish run, a blue triangle appears.
This signals potential weakening of the active trend.
5️⃣ Price Zones — Premium, Equilibrium, Discount
TrendPilot AI v2 draws 3 smart price zones based on ATR & market structure:
🟥 Premium Zone (Top) → Overbought area, caution for long trades
🟨 Equilibrium Zone (Middle) → Fair value, consolidation possible
🟩 Discount Zone (Bottom) → Oversold, better long entries
These zones help filter signals and avoid entries in risky areas.
Example: Avoid Buy signals inside Premium zone.
🧪 Suggested Use:
✅ Timeframes: 15m / 1H / 4H / 1D
✅ Combine signals with zone analysis for optimal entries
✅ Use re-entry triangles to add or confirm during pullbacks
✅ Use weak signal warnings to tighten stops or manage risk
✅ Works best in trending environments or breakout markets
⚠️ Note for Users:
This script is not repainting. All signals are plotted with stable logic.
Past performance does not guarantee future results — always backtest first.
Script does not contain financial advice — use at your own discretion.
Skrip dilindungi
Skrip ini diterbitkan sebagai sumber tertutup. Akan tetapi, anda boleh menggunakannya secara bebas dan tanpa apa-apa had – ketahui lebih di sini.
Penafian
Maklumat dan penerbitan adalah tidak bertujuan, dan tidak membentuk, nasihat atau cadangan kewangan, pelaburan, dagangan atau jenis lain yang diberikan atau disahkan oleh TradingView. Baca lebih dalam Terma Penggunaan.