The All Seeing Eye
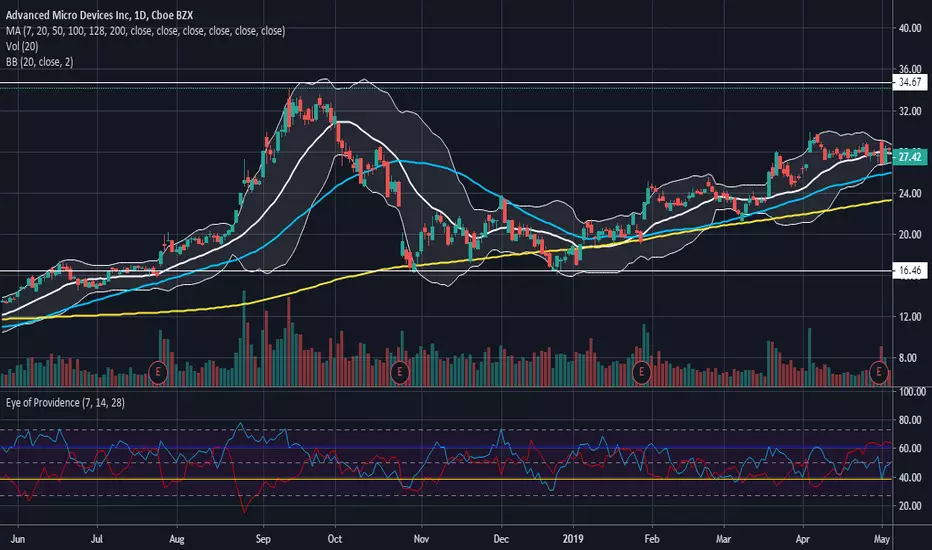
The 50 center line indicates the beginning or end of a trend based on the direction of the cross of the Ultimate Oscillator . Trend Strength is indicated by the position of the Trend Energy Index. Use this oscillator in the same way you would use the Ultimate Oscillator while considering the strength of the trend via the multiple Trend Energy Index. Entry and exit points are identified when the Trend Energy Index is in a trending state or spikes sharply downwards from an energy level near 61.8 and higher than 50. When the Trend Energy Index crosses above the 50 center line, it indicates the trend has ended. When it crosses below the 50 center line, it indicates a trend is beginning. Sharp changes in the direction of the Trend Energy Index at the 1 and 2 standard deviation key levels are usually accompanied by the same reaction from the Ultimate Oscillator indicating the trend may be entering a pullback or consolidation period. The Ultimate Oscillator will tell you the likely direction of the trend based on its slope between time intervals, as well as its position being above or below 50. Again, use the Ultimate Oscillator as you would RSI . Overbought and Oversold levels are indicated at the 2 standard deviation levels from the center line in relation to the Ultimate Oscillator . These levels are 27.2 for oversold and 72.8 for overbought.
The power of this oscillator comes from the reactivity of the Trend Energy Index in alerting you of trend strengthening or weakening of the predominant trend indicated by the Ultimate Oscillator . Pairing these two together produces great accuracy in Identifying reversals, exit points, and entry points. Additionally, the Ultimate Oscillator gives much less false divergence readings than standard RSI , and pairing with the ability of the Trend Energy Index to identify trend strength on any time frame allows great versatility while maintaining accuracy.
Because of the nature of this oscillators design, it is suited for use under any time frame and any volatility level. However, I personally have found it to be most accurate under low to medium-high volatility levels in a weekly time frame or shorter. Accuracy begins to be lost once the time frames are monthly or higher. It is recommended to use this oscillator with a volume indicator and a secondary momentum indicator such as MACD to verify signals from the All Seeing Eye for the highest degree of accuracy to be achieved.
Easy to read and notable trend states to get you started:
Blue line above 50 and red line below 50 = Uptrend
Both blue line and red line below 50 = Downtrend
Blue line 2 standard deviations above 50 and red line 2 standard deviations below 50 = Strong uptrend
Both blue line and red line 2 standard deviations below 50 = Strong downtrend
Red line at 1 standard deviation below 50 = weak trend
Red line at 2 standard deviations below 50 = strong trend
Red line at 1 standard deviation above 50 = consolidation phase (very weak or no trend)
Red line at 2 standard deviations above 50 = dead in the water (no trend at all)
My #1 tip: Pay close attention to the slopes of both lines in this oscillator and their relationship to each other!
Skrip jemputan sahaja
Hanya pengguna disahkan oleh penulis boleh mengakses skrip ini. Anda perlu memohon dan mendapatkan kebenaran untuk menggunakannya. Keizinan selalunya diberikan selepas pembayaran. Untuk lebih butiran, ikuti arahan penulis di bawah atau hubungi Eclypsis secara terus.
TradingView TIDAK menyarankan pembayaran atau penggunaan skrip kecuali anda mempercayai sepenuhnya penulis dan memahami bagaimana ia berfungsi. Anda juga boleh menjumpai alternatif sumber terbuka dan percuma yang lain di dalam skrip komuniti kami.
Arahan penulis
Penafian
Skrip jemputan sahaja
Hanya pengguna disahkan oleh penulis boleh mengakses skrip ini. Anda perlu memohon dan mendapatkan kebenaran untuk menggunakannya. Keizinan selalunya diberikan selepas pembayaran. Untuk lebih butiran, ikuti arahan penulis di bawah atau hubungi Eclypsis secara terus.
TradingView TIDAK menyarankan pembayaran atau penggunaan skrip kecuali anda mempercayai sepenuhnya penulis dan memahami bagaimana ia berfungsi. Anda juga boleh menjumpai alternatif sumber terbuka dan percuma yang lain di dalam skrip komuniti kami.