OPEN-SOURCE SCRIPT
Auto Darvas Boxes
## AUTO DARVAS BOXES
---
### OVERVIEW
**Auto Darvas Boxes** is a fully-automated, event-driven implementation of Nicolas Darvas’s 1950s box methodology.
The script tracks consolidation zones in real time, verifies that price truly “respects” those zones for a fixed validation window, then waits for the first decisive range violation to mark a directional breakout.
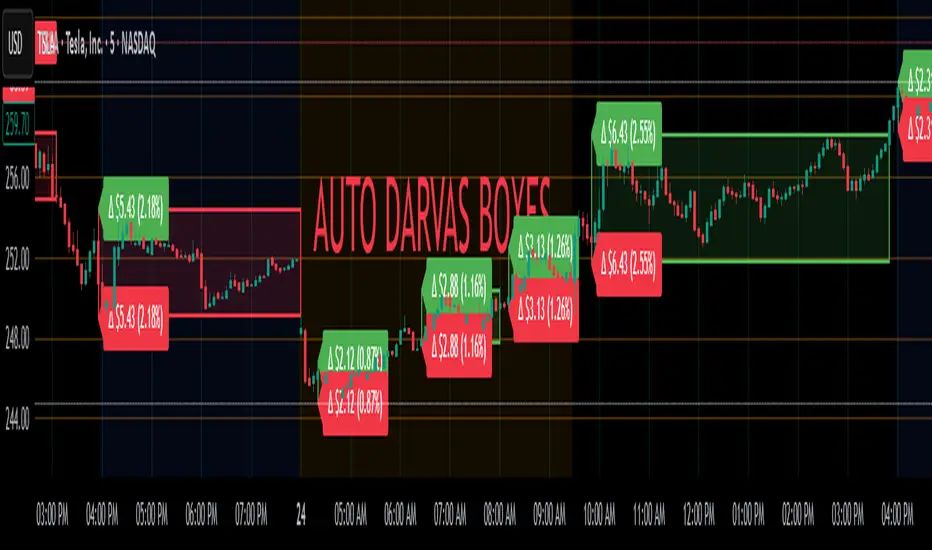
Every box is plotted end-to-end—from the first candle of the sideways range to the exact candle that ruptures it—giving you an on-chart, visually precise record of accumulation or distribution and the expansion that follows.
---
### HISTORICAL BACKGROUND
* Nicolas Darvas was a professional ballroom dancer who traded U.S. equities by telegram while touring the world.
* Without live news or Level II, he relied exclusively on **price** to infer institutional intent.
* His core insight: true market-moving entities leave footprints in the form of tight ranges; once their buying (or selling) is complete, price erupts out of the “box.”
* Darvas’s original procedure was manual—he kept notebooks, drew rectangles around highs and lows, and entered only when price punched out of the roof of a valid box.
* This indicator distills that logic into a rolling, self-resetting state machine so you never miss a box or breakout on any timeframe.
---
### ALGORITHM DETAIL (FOUR-STATE MACHINE)
**STATE 0 – RANGE DEFINITION**
• Examine the last *N* candles (default 7).
• Record `rangeHigh = highest(high, N) + tolerance`.
• Record `rangeLow = lowest(low, N) – tolerance`.
• Remember the index of the earliest bar in this window (`startBar`).
• Immediately transition to STATE 1.
**STATE 1 – RANGE VALIDATION**
• Observe the next *N* candles (again default 7).
• If **any** candle prints `high > rangeHigh` or `low < rangeLow`, the validation fails and the engine resets to STATE 0 **beginning at the violating candle**—no halfway boxes, no overlap.
• If all *N* candles remain inside the range, the box becomes **armed** and we transition to STATE 2.
**STATE 2 – ARMED (LIVE VISUAL FEEDBACK)**
• Draw a **green horizontal line** at `rangeHigh`.
• Draw a **red horizontal line** at `rangeLow`.
• Lines are extended in real time so the user can see the “live” Darvas ceiling and floor.
• Engine waits indefinitely for a breakout candle:
– **Up-Breakout** if `high > rangeHigh`.
– **Down-Breakout** if `low < rangeLow`.
**STATE 3 – BREAKOUT & COOLDOWN**
• Upon breakout the script:
1. Deletes the live range lines.
2. Draws a **filled rectangle (box)** from `startBar` to the breakout bar.
◦ **Green fill** when price exits above the ceiling.
◦ **Red fill** when price exits below the floor.
3. Optionally prints two labels at the left edge of the box:
◦ Dollar distance = `rangeHigh − rangeLow`.
◦ Percentage distance = `(rangeHigh − rangeLow) / rangeLow × 100 %`.
• After painting, the script waits a **user-defined cooldown** (default = 7 bars) before reverting to STATE 0. The cooldown guarantees separation between consecutive tests and prevents overlapping rectangles.
---
### INPUT PARAMETERS (ALL ADJUSTABLE FROM THE SETTINGS PANEL)
* **BARS TO DEFINE RANGE** – Number of candles used for both the definition and validation windows. Classic Darvas logic uses 7 but feel free to raise it on higher timeframes or volatile instruments.
* **OPTIONAL TOLERANCE** – Absolute price buffer added above the ceiling and below the floor. Use a small tolerance to ignore single-tick spikes or data-feed noise.
* **COOLDOWN BARS AFTER BREAKOUT** – How long the engine pauses before hunting for the next consolidation. Setting this equal to the range length produces non-overlapping, evenly spaced boxes.
* **SHOW BOX DISTANCE LABELS** – Toggle on/off. When on, each completed box displays its vertical size in both dollars and percentage, anchored at the box’s left edge.
---
### REAL-TIME VISUALISATION
* During the **armed** phase you see two extended, colour-coded guide-lines showing the exact high/low that must hold.
* When the breakout finally occurs, those lines vanish and the rectangle instantly appears, coloured to match the breakout direction.
* This immediate visual feedback turns any chart into a live Darvas tape—no manual drawing, no lag.
---
### PRACTICAL USE-CASES & BEST-PRACTICE WORKFLOWS
* **INTRADAY MOMENTUM** – Drop the script on 1- to 15-minute charts to catch tight coils before they explode. The coloured box marks the precise origin of the expansion; stops can sit just inside the opposite side of the box.
* **SWING & POSITION TRADING** – On 4-hour or daily charts, boxes often correspond to accumulation bases or volatility squeezes. Waiting for the box-validated breakout filters many false signals.
* **MEAN-REVERSION OR “FADE” STRATEGIES** – If a breakout immediately fails and price re-enters the box, you may have trapped momentum traders; fading that failure can be lucrative.
* **RISK MANAGEMENT** – Box extremes provide objective, structure-based stop levels rather than arbitrary ATR multiples.
* **BACK-TEST RESEARCH** – Because each box is plotted from first range candle to breakout candle, you can programmatically measure hold time, range height, and post-breakout expectancy for any asset.
---
### CUSTOMISATION IDEAS FOR POWER USERS
* **VOLATILITY-ADAPTIVE WINDOW** – Replace the fixed 7-bar length with a dynamic value tied to ATR percentile so the consolidation window stretches or compresses with volatility.
* **MULTI-TIMEFRAME LOGIC** – Only arm a 5-minute box if the 1-hour trend is aligned.
* **STRATEGY WRAPPER** – Convert the indicator to a full `strategy{}` script, automate entries on breakouts, and benchmark performance across assets.
* **ALERTS** – Create TradingView alerts on both up-breakout and down-breakout conditions; route them to webhook for broker automation.
---
### FINAL THOUGHTS
**Auto Darvas Boxes** packages one of the market’s oldest yet still potent price-action frameworks into a modern, self-resetting indicator. Whether you trade equities, futures, crypto, or forex, the script highlights genuine contraction-expansion sequences—Darvas’s original “boxes”—with zero manual effort, letting you focus solely on execution and risk.
---
### OVERVIEW
**Auto Darvas Boxes** is a fully-automated, event-driven implementation of Nicolas Darvas’s 1950s box methodology.
The script tracks consolidation zones in real time, verifies that price truly “respects” those zones for a fixed validation window, then waits for the first decisive range violation to mark a directional breakout.
Every box is plotted end-to-end—from the first candle of the sideways range to the exact candle that ruptures it—giving you an on-chart, visually precise record of accumulation or distribution and the expansion that follows.
---
### HISTORICAL BACKGROUND
* Nicolas Darvas was a professional ballroom dancer who traded U.S. equities by telegram while touring the world.
* Without live news or Level II, he relied exclusively on **price** to infer institutional intent.
* His core insight: true market-moving entities leave footprints in the form of tight ranges; once their buying (or selling) is complete, price erupts out of the “box.”
* Darvas’s original procedure was manual—he kept notebooks, drew rectangles around highs and lows, and entered only when price punched out of the roof of a valid box.
* This indicator distills that logic into a rolling, self-resetting state machine so you never miss a box or breakout on any timeframe.
---
### ALGORITHM DETAIL (FOUR-STATE MACHINE)
**STATE 0 – RANGE DEFINITION**
• Examine the last *N* candles (default 7).
• Record `rangeHigh = highest(high, N) + tolerance`.
• Record `rangeLow = lowest(low, N) – tolerance`.
• Remember the index of the earliest bar in this window (`startBar`).
• Immediately transition to STATE 1.
**STATE 1 – RANGE VALIDATION**
• Observe the next *N* candles (again default 7).
• If **any** candle prints `high > rangeHigh` or `low < rangeLow`, the validation fails and the engine resets to STATE 0 **beginning at the violating candle**—no halfway boxes, no overlap.
• If all *N* candles remain inside the range, the box becomes **armed** and we transition to STATE 2.
**STATE 2 – ARMED (LIVE VISUAL FEEDBACK)**
• Draw a **green horizontal line** at `rangeHigh`.
• Draw a **red horizontal line** at `rangeLow`.
• Lines are extended in real time so the user can see the “live” Darvas ceiling and floor.
• Engine waits indefinitely for a breakout candle:
– **Up-Breakout** if `high > rangeHigh`.
– **Down-Breakout** if `low < rangeLow`.
**STATE 3 – BREAKOUT & COOLDOWN**
• Upon breakout the script:
1. Deletes the live range lines.
2. Draws a **filled rectangle (box)** from `startBar` to the breakout bar.
◦ **Green fill** when price exits above the ceiling.
◦ **Red fill** when price exits below the floor.
3. Optionally prints two labels at the left edge of the box:
◦ Dollar distance = `rangeHigh − rangeLow`.
◦ Percentage distance = `(rangeHigh − rangeLow) / rangeLow × 100 %`.
• After painting, the script waits a **user-defined cooldown** (default = 7 bars) before reverting to STATE 0. The cooldown guarantees separation between consecutive tests and prevents overlapping rectangles.
---
### INPUT PARAMETERS (ALL ADJUSTABLE FROM THE SETTINGS PANEL)
* **BARS TO DEFINE RANGE** – Number of candles used for both the definition and validation windows. Classic Darvas logic uses 7 but feel free to raise it on higher timeframes or volatile instruments.
* **OPTIONAL TOLERANCE** – Absolute price buffer added above the ceiling and below the floor. Use a small tolerance to ignore single-tick spikes or data-feed noise.
* **COOLDOWN BARS AFTER BREAKOUT** – How long the engine pauses before hunting for the next consolidation. Setting this equal to the range length produces non-overlapping, evenly spaced boxes.
* **SHOW BOX DISTANCE LABELS** – Toggle on/off. When on, each completed box displays its vertical size in both dollars and percentage, anchored at the box’s left edge.
---
### REAL-TIME VISUALISATION
* During the **armed** phase you see two extended, colour-coded guide-lines showing the exact high/low that must hold.
* When the breakout finally occurs, those lines vanish and the rectangle instantly appears, coloured to match the breakout direction.
* This immediate visual feedback turns any chart into a live Darvas tape—no manual drawing, no lag.
---
### PRACTICAL USE-CASES & BEST-PRACTICE WORKFLOWS
* **INTRADAY MOMENTUM** – Drop the script on 1- to 15-minute charts to catch tight coils before they explode. The coloured box marks the precise origin of the expansion; stops can sit just inside the opposite side of the box.
* **SWING & POSITION TRADING** – On 4-hour or daily charts, boxes often correspond to accumulation bases or volatility squeezes. Waiting for the box-validated breakout filters many false signals.
* **MEAN-REVERSION OR “FADE” STRATEGIES** – If a breakout immediately fails and price re-enters the box, you may have trapped momentum traders; fading that failure can be lucrative.
* **RISK MANAGEMENT** – Box extremes provide objective, structure-based stop levels rather than arbitrary ATR multiples.
* **BACK-TEST RESEARCH** – Because each box is plotted from first range candle to breakout candle, you can programmatically measure hold time, range height, and post-breakout expectancy for any asset.
---
### CUSTOMISATION IDEAS FOR POWER USERS
* **VOLATILITY-ADAPTIVE WINDOW** – Replace the fixed 7-bar length with a dynamic value tied to ATR percentile so the consolidation window stretches or compresses with volatility.
* **MULTI-TIMEFRAME LOGIC** – Only arm a 5-minute box if the 1-hour trend is aligned.
* **STRATEGY WRAPPER** – Convert the indicator to a full `strategy{}` script, automate entries on breakouts, and benchmark performance across assets.
* **ALERTS** – Create TradingView alerts on both up-breakout and down-breakout conditions; route them to webhook for broker automation.
---
### FINAL THOUGHTS
**Auto Darvas Boxes** packages one of the market’s oldest yet still potent price-action frameworks into a modern, self-resetting indicator. Whether you trade equities, futures, crypto, or forex, the script highlights genuine contraction-expansion sequences—Darvas’s original “boxes”—with zero manual effort, letting you focus solely on execution and risk.
Skrip sumber terbuka
Dalam semangat TradingView sebenar, pencipta skrip ini telah menjadikannya sumber terbuka, jadi pedagang boleh menilai dan mengesahkan kefungsiannya. Terima kasih kepada penulis! Walaupuan anda boleh menggunakan secara percuma, ingat bahawa penerbitan semula kod ini tertakluk kepada Peraturan Dalaman.
Penafian
Maklumat dan penerbitan adalah tidak bertujuan, dan tidak membentuk, nasihat atau cadangan kewangan, pelaburan, dagangan atau jenis lain yang diberikan atau disahkan oleh TradingView. Baca lebih dalam Terma Penggunaan.