OPEN-SOURCE SCRIPT
Daily and Weekly Moving Averages on Daily Chart
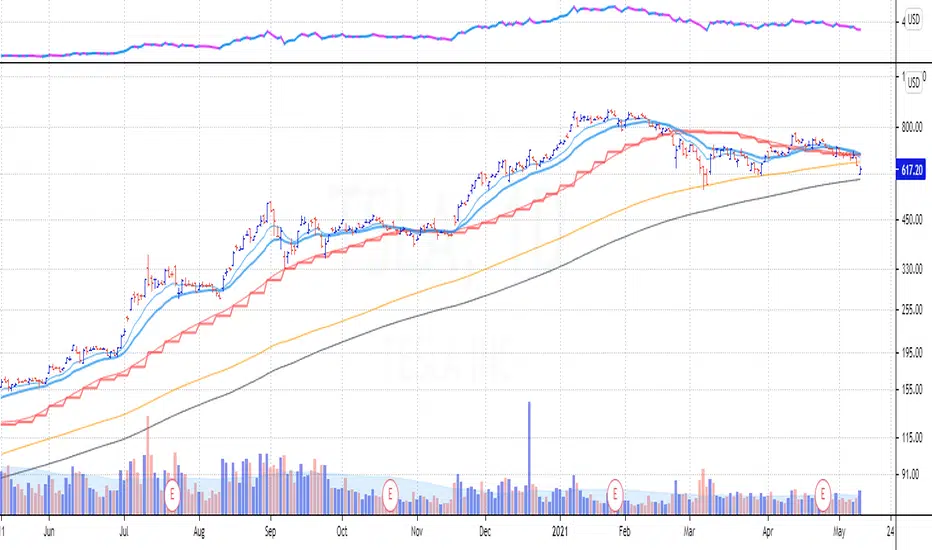
For the long term trend I use the 200 and 150 daily moving averages. The 200-day MA will be plotted as a black line. It is a no-go zone to buy anything trading below that.
The 150-day, or 30-week like Stan Weinstein uses, is plotted in orange.
Than I use the 50 day moving average but also the 10 week moving average. While those look similar there is a small difference which sometimes impacts the choice for selling a stock or holding on to it.
That slight difference is useful in different situations that’s why I want to have them both on my chart.
Both the 50-day and the 10-week are plotted as red lines on the chart. Since there’s only a small difference the same color gives a nicer view.
For shorter term trend I like to use the 20 and 10 day exponential moving averages. I tested these but also the commonly used 21, 9 and some other variations. But came to the conclusion that for me the 20EMA and 10EMA works best.
Both EMA’s are plotted in blue, where the 20EMA has a thicker line to easily see the difference.
Skrip sumber terbuka
Dalam semangat TradingView sebenar, pencipta skrip ini telah menjadikannya sumber terbuka, jadi pedagang boleh menilai dan mengesahkan kefungsiannya. Terima kasih kepada penulis! Walaupuan anda boleh menggunakan secara percuma, ingat bahawa penerbitan semula kod ini tertakluk kepada Peraturan Dalaman.
Penafian
Maklumat dan penerbitan adalah tidak bertujuan, dan tidak membentuk, nasihat atau cadangan kewangan, pelaburan, dagangan atau jenis lain yang diberikan atau disahkan oleh TradingView. Baca lebih dalam Terma Penggunaan.