OPEN-SOURCE SCRIPT
McClellan Summation Index [LazyBear]
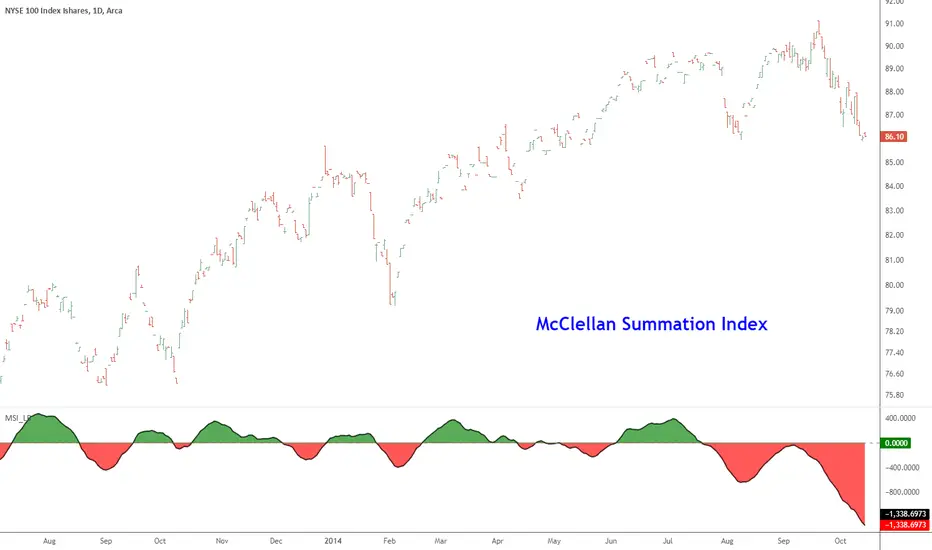
McClellan Summation Index is a breadth indicator derived from McClellan Oscillator (tradingview.com/v/8YstxIAf/).
The Summation Index is simply a running total of the McClellan Oscillator values. Even though it is called a Summation Index, the indicator is really an oscillator that fluctuates above/below zero. As such, signals can be derived from bullish/bearish divergences, directional movement and centerline crossovers. A moving average can also be applied to identify upturns and downturns.
Indicator uses the advancing/declining stocks from NYSE by default, but you can change them to any market in the options dialog.
More info:
- mcoscillator.com/learning_center/kb/mcclellan_oscillator/the_mcclellan_oscillator_summation_index/
- stockcharts.com/school/doku.php?id=chart_school:technical_indicators:mcclellan_summation
Complete list of my indicators:
docs.google.com/document/d/15AGCufJZ8CIUvwFJ9W-IKns88gkWOKBCvByMEvm5MLo/edit?usp=sharing
Skrip sumber terbuka
Dalam semangat sebenar TradingView, pencipta skrip ini telah menjadikannya sumber terbuka supaya pedagang dapat menilai dan mengesahkan kefungsiannya. Terima kasih kepada penulis! Walaupun anda boleh menggunakannya secara percuma, ingat bahawa menerbitkan semula kod ini adalah tertakluk kepada Peraturan Dalaman kami.
List of my free indicators: bit.ly/1LQaPK8
List of my indicators at Appstore: blog.tradingview.com/?p=970
List of my indicators at Appstore: blog.tradingview.com/?p=970
Penafian
Maklumat dan penerbitan adalah tidak dimaksudkan untuk menjadi, dan tidak membentuk, nasihat untuk kewangan, pelaburan, perdagangan dan jenis-jenis lain atau cadangan yang dibekalkan atau disahkan oleh TradingView. Baca dengan lebih lanjut di Terma Penggunaan.