PROTECTED SOURCE SCRIPT
Telah dikemas kini CFX - Plot HTF Bar
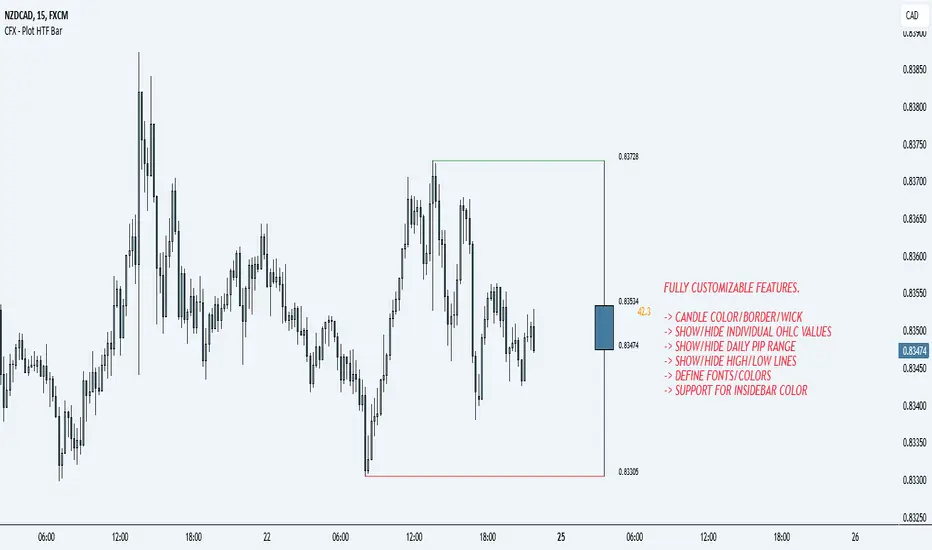
If you lose track of what's going on while being on the lower timeframes, you can use this indicator in order to plot the higher timeframe bar to the right hand side of the chart.
Supports multiple timeframes
Supports different colors
Supports different color for inside bars
Supports toggle-able pip range
Supports multiple timeframes
Supports different colors
Supports different color for inside bars
Supports toggle-able pip range
Nota Keluaran
Updated to fix bugs and contain new features.Nota Keluaran
Added new features, made everything customizable.New Features:
- Individual high/low lines that can be configured for colors/styles
- OHLC values that can be individually turned on/off and adjusted for font/color
- Plotted Bar Pip Range text that can be adjusted for font/color
- Defined logic for bar visible on higher timeframes than the input value.
Known Issues:
- Going on a lower timeframe(seconds) with too large of an input timeframe on the candle will cause top/high lines not to display. This is due to a limitation of tradingview's max candles to look back
Changelog:
- Candle draw logic has been heavily simplified which should make it faster.
Feel free to leave suggestions/post if there are any issues.
I will do my best to look into it and fix it as I actively use this indicator myself.
~Cold
Nota Keluaran
Fixed high/low drawing logic. In previous version it was influenced by the brokers.FXCM and others that have very slight price gaps/differences on various time frames were not showing properly. It should now be fixed.
Nota Keluaran
Features are now a checkbox instead of a drop down ON/OFFSkrip dilindungi
Skrip ini diterbitkan sebagai sumber tertutup. Akan tetapi, anda boleh menggunakannya secara bebas dan tanpa apa-apa had – ketahui lebih di sini.
Penafian
Maklumat dan penerbitan adalah tidak bertujuan, dan tidak membentuk, nasihat atau cadangan kewangan, pelaburan, dagangan atau jenis lain yang diberikan atau disahkan oleh TradingView. Baca lebih dalam Terma Penggunaan.
Skrip dilindungi
Skrip ini diterbitkan sebagai sumber tertutup. Akan tetapi, anda boleh menggunakannya secara bebas dan tanpa apa-apa had – ketahui lebih di sini.
Penafian
Maklumat dan penerbitan adalah tidak bertujuan, dan tidak membentuk, nasihat atau cadangan kewangan, pelaburan, dagangan atau jenis lain yang diberikan atau disahkan oleh TradingView. Baca lebih dalam Terma Penggunaan.