PROTECTED SOURCE SCRIPT
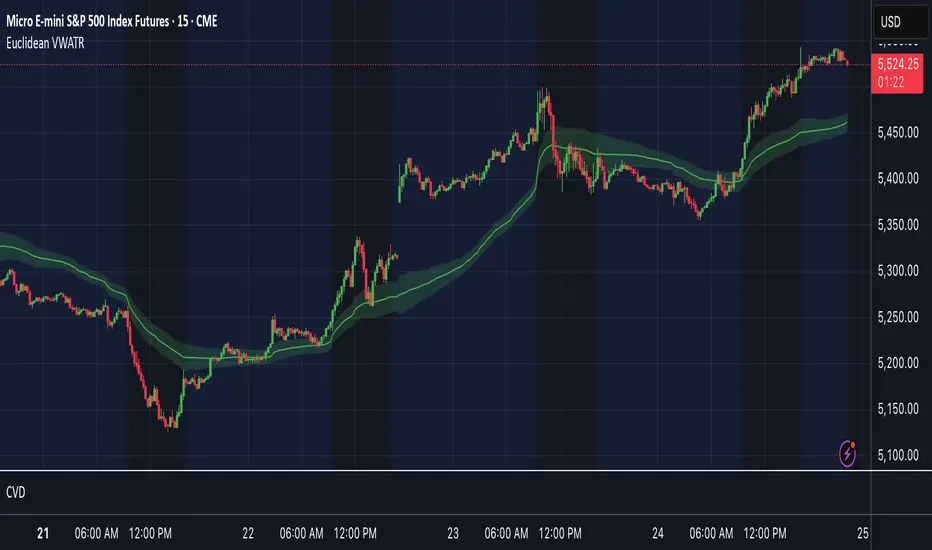
Euclidean VWATR
Overview
Dual-Centroid ATR Cluster Bands is an on-chart indicator that dynamically clusters price around two evolving centroids and builds volatility-based bands around each. By combining an online Euclidean update with average true range (ATR) and volume weighting, it creates two adaptive support/resistance zones and highlights which cluster price belongs to on each bar.
Key Features
- Two adaptive centroids that move toward price based on proximity and volume
- ATR-based upper and lower bands around each centroid to show volatility zones
- Volume weighting so high-volume bars shift centroids faster
- Background shading to show whether the current bar belongs to the red or green cluster
- Optional breakout flags for when price crosses each band (not tied to automated entries or exits)
Inputs
Learning Rate: speed at which centroids adapt to new price (0–1). Default = 0.025
Init Centroid 1 / Init Centroid 2: starting value for each centroid (0 uses the first bar’s close). Default = 0.0
ATR Length: lookback period for ATR calculation. Default = 14
ATR Band Multiplier: multiple of ATR used for upper and lower bands. Default = 1.5
Volume SMA Length: lookback period for smoothing volume to compute relative weight. Default = 20
Interpretation & Usage
- Trend vs. mean-reversion: price oscillating inside a colored zone suggests mean-reversion to that centroid.
- Equilibrium shifts: a move toward the midpoint between centroids may signal a cluster change.
- Breakout signals: use price crosses of the ATR bands as potential momentum entries (combine with volume or other filters).
- Dynamic support/resistance: treat the centroids and their bands as floating levels that adapt to market conditions.
- Volume sensitivity: high-volume moves will pull the centroids more strongly, making zones more responsive during heavy trading.
Recommended Tips
- Increase Learning Rate for faster adaptation in volatile markets.
- Raise ATR Band Multiplier in choppy conditions to reduce false breakouts.
- Adjust Volume SMA Length to emphasize recent or longer-term volume trends.
- Combine with other indicators (pivot points, VWAP, trend filters) for filtered entries.
Skrip dilindungi
Skrip ini diterbitkan sebagai sumber tertutup. Akan tetapi, anda boleh menggunakannya secara bebas dan tanpa apa-apa had – ketahui lebih di sini.
Penafian
Maklumat dan penerbitan adalah tidak bertujuan, dan tidak membentuk, nasihat atau cadangan kewangan, pelaburan, dagangan atau jenis lain yang diberikan atau disahkan oleh TradingView. Baca lebih dalam Terma Penggunaan.