PROTECTED SOURCE SCRIPT
[Pandora's Chambers] BUY/SELL Blocks + Strength FC
Based on the secret technique of ATTA,
Traditional price action analysis techniques, such as ICT (Inner Circle Trader), are often based on subjective interpretations and frequently miss the true structure of the market according to the Wyckoff method. The "[Pandora’s Chambers] BUY/SELL Blocks + Strength FC" indicator aims to correct this problem by automatically and accurately identifying buy/sell "blocks" according to Wyckoff principles, calculating volume strength, filtering breached blocks, and displaying precise support and resistance levels.
Indicator Highlights
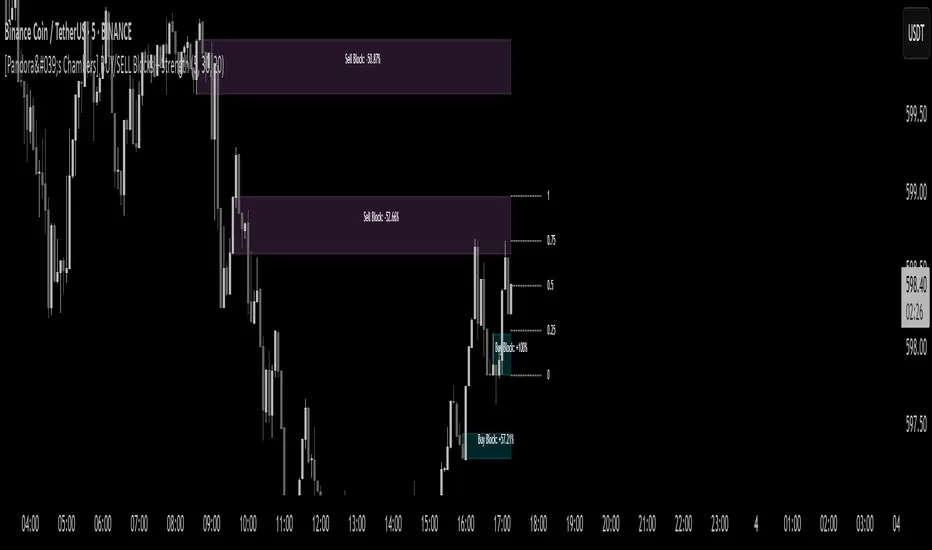
Buy/Sell Blocks Identification
Uses the ta.pivothigh and ta.pivotlow functions to locate upper and lower pivot points, and draws a "box" between the two points to represent the block.
Each block is automatically extended to the right of the chart (can be disabled in settings) for a fixed number of bars or until the end of the chart.
Colors are configurable: turquoise shades for buy blocks, and purple for sell blocks.
Volume Strength Calculation and Update
In each candle, positive volume (in a rising market) or negative volume (in a falling market) is added to the relevant block.
Displays in percentages which side (buyers/sellers) controls the block: a label on the block shows +XX% or -XX%.
Changes the background color of the box to gray when the net volume flips (e.g., a strong sell block receives a net positive).
Filtering Breached Blocks
Option to automatically filter and remove blocks where the price has closed above the top of the sell block or below the bottom of the buy block, in order to maintain a clean and focused chart.
"Adjusted" Fibonacci Grid
In the last calculated bars, the indicator identifies the nearest high support level (sup) and the nearest low resistance level (res) among all existing blocks.
Based on sup and res, a Fibonacci grid of 0%, 25%, 50%, 75%, and 100% is constructed, automatically updating as the chart progresses.
What is so new here?
Accuracy according to Wyckoff and not personal interpretation: In the Wyckoff method, market oscillations are built on supply and demand balances in precise price gaps. Here, each block is built directly on pivots from a number of bars back, and not on feelings of an "area" as is sometimes done in ICT techniques.
Quantitative measurement of control: The indicator does not settle for a visual identification of a block but calculates for each block the buy volume versus the sell volume, and clearly displays who is in control.
Automatic filtering to maintain relevance: Breached blocks are removed, so only the strong areas that have not yet been closed remain.
Full integration with modern price action: Understanding price movement is measured here objectively, leaving no room for subjective interpretations of "structure breaks" or "diagonal waves" that standard tools do not support.
Why is the existing price action not enough?
Inconsistency in defining supply and demand zones: Many techniques rely on manual marking of "buy zones" only, without fixed criteria (number of bars back, low highs, volume, etc.).
Scarcity of quantitative indicators: Without calculating net volume, it is difficult to know if a particular block is truly supported by the power of buyers or sellers.
Net invalidation of blocks that have been violated: Repeated breaches of support and resistance areas below/above their boundaries confuse the trader, while here they are automatically removed.
The "[Pandora’s Chambers] BUY/SELL Blocks + Strength FC" indicator comes to correct all these shortcomings, and provides the user with an objective, accurate, and quantitative framework for understanding the dynamics of the market and identifying volume-based support and resistance areas, according to the principles of the Wyckoff method.
Traditional price action analysis techniques, such as ICT (Inner Circle Trader), are often based on subjective interpretations and frequently miss the true structure of the market according to the Wyckoff method. The "[Pandora’s Chambers] BUY/SELL Blocks + Strength FC" indicator aims to correct this problem by automatically and accurately identifying buy/sell "blocks" according to Wyckoff principles, calculating volume strength, filtering breached blocks, and displaying precise support and resistance levels.
Indicator Highlights
Buy/Sell Blocks Identification
Uses the ta.pivothigh and ta.pivotlow functions to locate upper and lower pivot points, and draws a "box" between the two points to represent the block.
Each block is automatically extended to the right of the chart (can be disabled in settings) for a fixed number of bars or until the end of the chart.
Colors are configurable: turquoise shades for buy blocks, and purple for sell blocks.
Volume Strength Calculation and Update
In each candle, positive volume (in a rising market) or negative volume (in a falling market) is added to the relevant block.
Displays in percentages which side (buyers/sellers) controls the block: a label on the block shows +XX% or -XX%.
Changes the background color of the box to gray when the net volume flips (e.g., a strong sell block receives a net positive).
Filtering Breached Blocks
Option to automatically filter and remove blocks where the price has closed above the top of the sell block or below the bottom of the buy block, in order to maintain a clean and focused chart.
"Adjusted" Fibonacci Grid
In the last calculated bars, the indicator identifies the nearest high support level (sup) and the nearest low resistance level (res) among all existing blocks.
Based on sup and res, a Fibonacci grid of 0%, 25%, 50%, 75%, and 100% is constructed, automatically updating as the chart progresses.
What is so new here?
Accuracy according to Wyckoff and not personal interpretation: In the Wyckoff method, market oscillations are built on supply and demand balances in precise price gaps. Here, each block is built directly on pivots from a number of bars back, and not on feelings of an "area" as is sometimes done in ICT techniques.
Quantitative measurement of control: The indicator does not settle for a visual identification of a block but calculates for each block the buy volume versus the sell volume, and clearly displays who is in control.
Automatic filtering to maintain relevance: Breached blocks are removed, so only the strong areas that have not yet been closed remain.
Full integration with modern price action: Understanding price movement is measured here objectively, leaving no room for subjective interpretations of "structure breaks" or "diagonal waves" that standard tools do not support.
Why is the existing price action not enough?
Inconsistency in defining supply and demand zones: Many techniques rely on manual marking of "buy zones" only, without fixed criteria (number of bars back, low highs, volume, etc.).
Scarcity of quantitative indicators: Without calculating net volume, it is difficult to know if a particular block is truly supported by the power of buyers or sellers.
Net invalidation of blocks that have been violated: Repeated breaches of support and resistance areas below/above their boundaries confuse the trader, while here they are automatically removed.
The "[Pandora’s Chambers] BUY/SELL Blocks + Strength FC" indicator comes to correct all these shortcomings, and provides the user with an objective, accurate, and quantitative framework for understanding the dynamics of the market and identifying volume-based support and resistance areas, according to the principles of the Wyckoff method.
Skrip dilindungi
Skrip ini diterbitkan sebagai sumber tertutup. Akan tetapi, anda boleh menggunakannya secara bebas dan tanpa apa-apa had – ketahui lebih di sini.
Penafian
Maklumat dan penerbitan adalah tidak bertujuan, dan tidak membentuk, nasihat atau cadangan kewangan, pelaburan, dagangan atau jenis lain yang diberikan atau disahkan oleh TradingView. Baca lebih dalam Terma Penggunaan.