OPEN-SOURCE SCRIPT
Telah dikemas kini ATR: Body % + Ranges and Anomalies
ATR: Body % + Ranges and Anomalies
This indicator provides a dual analysis of price bars to help you better understand market dynamics and volatility. It combines two powerful concepts into one tool: a candle body percentage and a range analysis with an anomaly-excluding average.
Key Features:
1. Candle Body Percentage
This feature plots the size of the candle's body as a percentage of its total high-low range.
A high percentage (e.g., above the 50% gray line) indicates strong, directional movement. The more solid the body is relative to its wicks, the more conviction is behind that move.
The 100% red line marks "Marubozu" candles—bars with no wicks, showing absolute control by buyers or sellers.
2. Range Analysis with Anomalies
This is a unique part of the indicator that helps you identify and understand normal vs. abnormal volatility.
Custom SMA: It calculates an average range of the last N bars, but it smartly excludes "anomalous" bars (spikes or unusually small ranges) from the calculation. This gives you a more reliable baseline for normal volatility.
Anomaly Detection: Bars are colored differently based on their range:
Blue: Small anomalies (range less than 0.5 * ATR). These often occur during periods of low liquidity or indecision.
Red: Large anomalies (range greater than 1.8 * ATR). These can signal a sudden burst of volatility, breakout events, or capitulation.
ATR Range % Label: The label on the chart shows the current bar's range as a percentage of the custom SMA. This tells you how much larger or smaller the current bar's range is compared to a clean average.
How to Use:
Spotting Trends: Use the Body % to confirm the strength of a trend. A series of bars with high body percentages can indicate a strong, healthy trend.
Identifying Volatility: Use the Range Analysis to find areas of interest. A large red anomaly bar could signal a significant event, while a series of blue anomalies might suggest the market is in a tight consolidation before a breakout.
Contextual Analysis: The combination of these tools can provide powerful context. For example, a bar with a high Body % and a red anomaly color suggests a strong, volatile move that could be a turning point or the start of a major trend.
Experiment with the input settings to fine-tune the ATR and SMA periods for different timeframes and assets.
Nota Keluaran
ATR: Body % + Ranges and AnomaliesThis indicator provides a dual analysis of price bars to help you better understand market dynamics and volatility. It combines two powerful concepts into one tool: a candle body percentage and a range analysis with an anomaly-excluding average.
Key Features:
1. Candle Body Percentage
This feature plots the size of the candle's body as a percentage of its total high-low range.
A high percentage (e.g., above the 50% gray line) indicates strong, directional movement. The more solid the body is relative to its wicks, the more conviction is behind that move.
The 100% red line marks "Marubozu" candles—bars with no wicks, showing absolute control by buyers or sellers.
2. Range Analysis with Anomalies
This is a unique part of the indicator that helps you identify and understand normal vs. abnormal volatility.
Custom SMA: It calculates an average range of the last N bars, but it smartly excludes "anomalous" bars (spikes or unusually small ranges) from the calculation. This gives you a more reliable baseline for normal volatility.
Anomaly Detection: Bars are colored differently based on their range:
Blue: Small anomalies (range less than 0.5 * ATR). These often occur during periods of low liquidity or indecision.
Red: Large anomalies (range greater than 1.8 * ATR). These can signal a sudden burst of volatility, breakout events, or capitulation.
ATR Range % Label: The label on the chart shows the current bar's range as a percentage of the custom SMA. This tells you how much larger or smaller the current bar's range is compared to a clean average.
How to Use:
Spotting Trends: Use the Body % to confirm the strength of a trend. A series of bars with high body percentages can indicate a strong, healthy trend.
Identifying Volatility: Use the Range Analysis to find areas of interest. A large red anomaly bar could signal a significant event, while a series of blue anomalies might suggest the market is in a tight consolidation before a breakout.
Contextual Analysis: The combination of these tools can provide powerful context. For example, a bar with a high Body % and a red anomaly color suggests a strong, volatile move that could be a turning point or the start of a major trend.
Experiment with the input settings to fine-tune the ATR and SMA periods for different timeframes and assets.
Nota Keluaran
Key changesTwo important changes have been made:
External anomaly detection: previousATR = ta.atr(atrPeriod)[1]
The current bar's anomaly is now determined by comparing its range with the ATR of the previous bar. This eliminates the lookahead bias.
SMA function: ta.atr(atrPeriod)[i+1]
Similarly, inside the f_sma_no_anomalies function, the anomaly test for each bar in the loop (i) now uses the ATR that was available before it was formed. This ensures a correct and logical SMA calculation that truly does not include anomalous bars.
Ключевые изменения
Внесены два важных изменения:
Внешнее определение аномалии: previousATR = ta.atr(atrPeriod)[1]
Теперь аномалия текущего бара определяется путём сравнения его диапазона с ATR предыдущего бара. Это исключает проблему "заглядывания вперёд" (lookahead bias).
Функция SMA: ta.atr(atrPeriod)[i+1]
Аналогично, внутри функции f_sma_no_anomalies проверка на аномалию для каждого бара в цикле (i) теперь использует ATR, который был доступен до его формирования. Это обеспечивает корректный и логически обоснованный расчёт SMA, который действительно не включает аномальные бары.
Nota Keluaran
AdjustmentNota Keluaran
ATR: Range & Anomaly AnalysisDescription
This indicator provides a deep analysis of volatility and candle ranges. It visually identifies abnormally large and small bars and calculates the average market volatility, excluding these anomalies. The indicator is ideal for traders who want to better understand market noise and the true strength of price movements.
Key Features
Bar Range Visualization: Displays the height of each bar as a histogram, allowing for a quick assessment of volatility.
Abnormally Large Bars: Automatically detects and highlights bars with an unusually high range. This helps identify sharp volatility spikes, which can be linked to important news events or the start of a strong trend.
Abnormally Small Bars: Highlights bars with an exceptionally low range. Such bars often precede consolidation or a period of calm before a major move.
Average Range (Excluding Anomalies): Calculates the average range over the last 5 bars, filtering out both abnormally large and small values. This provides a cleaner view of the market's true, "normal" volatility by filtering out noise.
Information Panel: Displays key metrics in real time, including the percentage of the candle's body relative to its total range (Body%) and the current bar's range as a percentage of the previous ATR value (ATR Range%).
How to Use
Add the indicator to your chart.
Go to the indicator's settings (Inputs).
ATR Period: Adjust the period for the average volatility calculation.
Anomaly Multipliers: Change the multipliers for large and small anomalies to fine-tune the indicator's sensitivity.
Bar Style: Navigate to the "Style" tab to customize the colors and display style for each bar type (normal, large, and small anomalies).
This indicator can be a valuable tool for making more informed trading decisions, helping you distinguish between normal market movements and extreme events.
Nota Keluaran
ATR: Range & Anomaly AnalysisDescription:
This indicator provides an in-depth analysis of volatility and candle ranges. It visually identifies abnormally large and small bars and calculates the average market volatility while excluding these anomalies. The indicator is a valuable tool for traders seeking to better understand market noise and the true strength of price movements.
Key Features:
Bar Range Visualization: Displays the height of each bar as a histogram, allowing for a quick assessment of volatility.
Abnormally Large Bars: Automatically detects and highlights bars with an exceptionally high range. This helps to pinpoint sharp volatility spikes that may be linked to significant news events or the start of a strong trend.
Abnormally Small Bars: Highlights bars with an unusually low range. These bars often signal a period of consolidation or a calm before a major move.
Average Range (Excluding Anomalies): Calculates the average range over the last 5 bars, filtering out both abnormally large and small values. This gives a cleaner, more accurate view of the market's "normal" volatility by filtering out noise.
Information Panel: Displays key metrics in real time: the current bar's range as a percentage of the previous ATR value and the current price progress from the open as a percentage of the previous ATR.
How to Use:
Add the indicator to your chart.
In the indicator settings (Inputs), adjust the ATR period and the anomaly multipliers to fine-tune the indicator's sensitivity.
In the "Style" tab, you can customize the colors and display styles for each type of bar (normal, large, and small anomalies).
This indicator can be a powerful addition to your trading toolkit, helping you to distinguish between typical market fluctuations and extreme events.
Nota Keluaran
AdjustmentNota Keluaran
Description in EnglishThis Pine Script indicator, named "Custom ATR with Anomaly Exclusion", is designed to analyze volatility with a unique approach: it calculates the average range (similar to ATR) by excluding abnormally large and small bars. This provides a cleaner view of an instrument's normal, day-to-day volatility, unskewed by sudden spikes or periods of extreme calm.
Key Features:
Cleaned Average Range: The indicator uses an array to store data only from "normal" bars (non-anomalies) and computes the average range based on them. This sets it apart from a standard ATR, which includes all bars in its calculation.
Anomaly Identification: Bars that are significantly larger or smaller than the "cleaned" average range are flagged as anomalies. The thresholds for these anomalies are customizable via the largeAnomalyMultiplier and smallAnomalyMultiplier inputs.
Calculation Flexibility: With the startDate input, you can specify the exact date from which all calculations and plot displays should begin. This is useful for backtesting or focusing on specific time periods.
Visual Representation: The indicator plots three types of bars—normal, abnormally large, and abnormally small—each with its own color. It also draws a line representing the average "cleaned" range on the chart.
Last Bar Information: A label on the most recent bar shows the current "cleaned" ATR value in points and the percentage of the current candle's body progress relative to that ATR, offering insight into intraday momentum.
Этот Pine Script индикатор, названный "Custom ATR with Anomaly Exclusion", разработан для анализа волатильности, но с уникальным подходом: он рассчитывает средний диапазон (аналог ATR), исключая аномально большие и малые бары. Это позволяет получить более "чистое" представление о нормальной, повседневной волатильности инструмента, не искаженное резкими скачками или затишьями.
Ключевые особенности:
Очищенный средний диапазон: Индикатор хранит в массиве данные только по "нормальным" барам (не аномалиям) и вычисляет средний диапазон на их основе. Это отличает его от стандартного ATR, который учитывает все бары.
Идентификация аномалий: Бары, которые значительно больше или меньше среднего "очищенного" диапазона, помечаются как аномалии. Пороги для аномалий настраиваются с помощью множителей largeAnomalyMultiplier и smallAnomalyMultiplier.
Гибкость расчетов: Благодаря входному параметру startDate, вы можете указать точную дату, с которой должны начинаться все расчеты и отображение данных, что удобно для тестирования или анализа конкретных периодов.
Визуальное представление: Индикатор отображает три вида баров: нормальные, аномально большие и аномально малые, каждый со своим цветом. Также на графике рисуется линия среднего "очищенного" диапазона.
Информация на последнем баре: Лейбл на последнем баре показывает текущее значение "очищенного" ATR в пунктах и процент прогресса тела текущей свечи относительно этого ATR, что дает представление о внутридневной силе движения.
Nota Keluaran
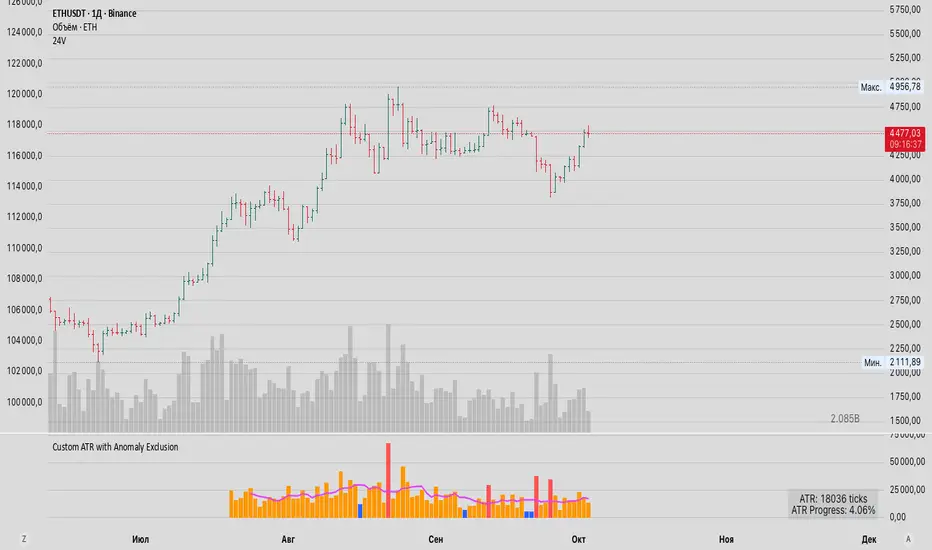
English DescriptionCustom ATR with Anomaly Exclusion
This indicator calculates an Average True Range (ATR) that is resilient to market anomalies (spikes or unusually narrow bars). It uses a specialized filtering technique to exclude bars whose range falls outside a user-defined threshold, providing a more stable and representative measure of normal volatility.
Key Features:
Anomaly Filtering: Bars whose range is either Abnormally Large (above Average Range * Large Multiplier) or Abnormally Small (below Average Range * Small Multiplier) are excluded from the rolling average calculation. This prevents sudden spikes or quiet periods from skewing the core volatility reading.
Visual Identification: The indicator plots all three bar types: Normal (the default color), Abnormally Large (Red by default), and Abnormally Small (Blue by default), allowing you to visually spot outliers.
Real-time Progress: An interactive Info Table displays the calculated Cleaned ATR value (in ticks) and the current bar's progress (Close-Open range) as a percentage of that ATR, helping traders gauge momentum against typical daily movement.
Start Date Control: Use the Start Date for Calculations input to define when the ATR calculation should begin, useful for ignoring historical data or focusing on a specific period.
This tool is invaluable for traders who want a smoother, more reliable volatility measure for setting stop-losses, take-profits, or validating price action momentum.
Skrip sumber terbuka
Dalam semangat TradingView sebenar, pencipta skrip ini telah menjadikannya sumber terbuka, jadi pedagang boleh menilai dan mengesahkan kefungsiannya. Terima kasih kepada penulis! Walaupuan anda boleh menggunakan secara percuma, ingat bahawa penerbitan semula kod ini tertakluk kepada Peraturan Dalaman.
Penafian
Maklumat dan penerbitan adalah tidak bertujuan, dan tidak membentuk, nasihat atau cadangan kewangan, pelaburan, dagangan atau jenis lain yang diberikan atau disahkan oleh TradingView. Baca lebih dalam Terma Penggunaan.