PROTECTED SOURCE SCRIPT
Telah dikemas kini Vortex Oscillator
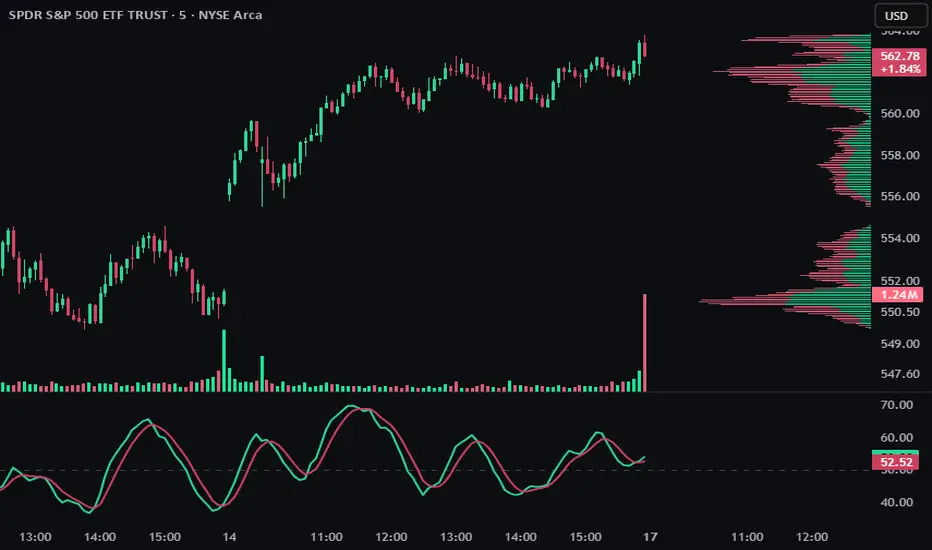
Vortex Oscillator (VO)
The Vortex Oscillator is a normalized adaptation of the classic Vortex Indicator, designed to simplify trend identification and provide clearer trading signals. This enhanced version transforms the traditional dual-line Vortex Indicator into a single oscillator that ranges from 0-100, with 50 as the center line.
How It Works
The indicator measures the directional movement of price through two core components:
- Positive movement (VM+): Measures upward price movement
- Negative movement (VM-): Measures downward price movement
These components are normalized relative to the Average True Range (ATR) to create a single oscillator that fluctuates between 0 and 100:
- Values above 50 indicate bullish momentum (VM+ dominates)
- Values below 50 indicate bearish momentum (VM- dominates)
- Crossovers between the oscillator and its signal line identify potential entry and exit points
Key Features
- Normalized Scale: Easy-to-read 0-100 scale instead of the traditional dual-line format
- Adjustable Sensitivity: Choose between Low, Medium, and High sensitivity to match your trading style
- Signal Line: Uses a weighted moving average for signal generation
- Optional Trade Labels: Visual buy/sell signals directly on the chart
How to Use This Indicator
- Trend Direction: Values above 50 suggest bullish conditions, below 50 suggest bearish conditions
- Signal Line Crossovers: When the oscillator crosses above the signal line, consider long positions; when it crosses below, consider short positions
- Divergence: Look for divergence between price and the oscillator for potential trend reversals
- Sensitivity Adjustment: Use higher sensitivity for shorter timeframes or more active trading; lower sensitivity for longer-term positions
Limitations
- Like all momentum oscillators, this indicator may generate false signals during ranging markets
- Performance is best when used in conjunction with other technical analysis tools
- The indicator has slight lag due to its smoothing components
Settings Explanation
- Length: The period used for calculating the Vortex components (default: 9)
- Sensitivity: Adjusts how quickly the oscillator responds to price changes (default: Medium)
- Signal Line Length: The period for the signal line (default: 6)
- Signal Line MA Type: The moving average type for the signal line (default: WMA)
- Show Trading Labels: Option to display buy/sell labels directly on the chart
For optimal results, consider using this oscillator alongside trend identification tools and support/resistance levels.
Nota Keluaran
Added PSAR and LabelsNota Keluaran
Bug fixSkrip dilindungi
Skrip ini diterbitkan sebagai sumber tertutup. Akan tetapi, anda boleh menggunakannya secara bebas dan tanpa apa-apa had – ketahui lebih di sini.
Penafian
Maklumat dan penerbitan adalah tidak bertujuan, dan tidak membentuk, nasihat atau cadangan kewangan, pelaburan, dagangan atau jenis lain yang diberikan atau disahkan oleh TradingView. Baca lebih dalam Terma Penggunaan.
Skrip dilindungi
Skrip ini diterbitkan sebagai sumber tertutup. Akan tetapi, anda boleh menggunakannya secara bebas dan tanpa apa-apa had – ketahui lebih di sini.
Penafian
Maklumat dan penerbitan adalah tidak bertujuan, dan tidak membentuk, nasihat atau cadangan kewangan, pelaburan, dagangan atau jenis lain yang diberikan atau disahkan oleh TradingView. Baca lebih dalam Terma Penggunaan.