Telah dikemas kini
Radi IQ [TradingIQ]
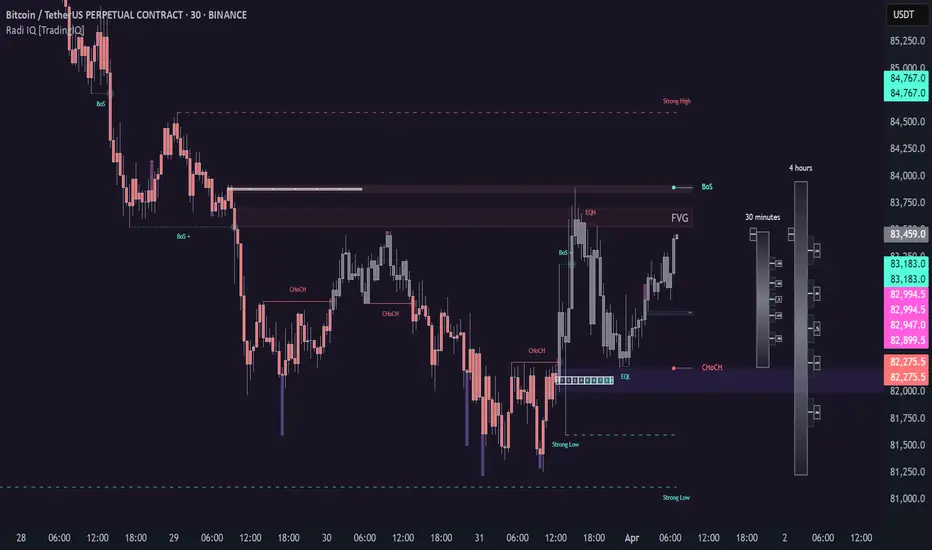
Introducing "Radi IQ".
Radi IQ is a comprehensive market structure indicator designed to provide traders with a detailed view of key price levels and market behavior. It combines several analytical methods—including internal and external structure analysis, fair value gaps, order blocks, breaker blocks, rejection blocks, premium discount zones, equal levels, directional liquidity grabs, and trend meters —to help users better understand areas of support and resistance, potential turning points, and liquidity events in the market.
Key Components and Their Functions
Market Structure Analysis
Internal and External Structure: The indicator evaluates market structure on two levels. The internal analysis focuses on immediate price action (e.g., recent support/resistance and swing points), while the external analysis uses a higher timeframe to provide context. This dual approach helps to confirm the strength of key levels by comparing short-term moves with the broader market trend.
Break of Structure (BoS) and Change of Character (CHoCH): These signals highlight moments when the market shifts its behavior. A BoS indicates that a previous level of support or resistance has been overcome, while a CHoCH signals a change in the market’s character. Both are marked clearly on the chart using distinct color codes.
Break of Structure + (BoS+) and Change of Character + (CHoCH+): These signals highlight moments when the market shifts its behavior and is confirmed by prior price action. A BoS + indicates that a previous level of support or resistance has been overcome, while price action achieves higher highs and higher lows (resistance break) or lower highs and lower lows (support break). CHoCH + signals a change in the market’s character when supported by prior price action - lower highs for a support break and higher lows for a resistance break.
BoS and CHoCH

The image above shows BoS and CHoCH identified on the price chart, and explains what each signifies.
A Break Of Structure (BoS) occurs when price decisively moves beyond a previously established support or resistance level. It indicates that the current trend or market pattern is being challenged, and the market may be ready to change direction.
A Change of Character (CHoCH) describes a shift in how the market behaves. A CHoCH occurs when, in an uptrend, a previously established support level breaks, or in a downtrend, a previously established resistance level breaks.
This break indicates that the market's typical structure is shifting, suggesting that the current trend may be losing its strength and that a reversal or a new trend could be developing.
CHoCH+

The image above explains CHoCH+ and how it forms, while highlighting an instance where a downside CHoCH+ formed following lower highs.
A Change of Character + (CHoCH+) describes a shift in how the market behaves that is supported by prior price action. For support breaks, price must form lower highs before breaking support.

The image above explains CHoCH+ for resistance breaks, while highlighting an instance where a resistance point broke that was supported by prior price action.
BoS+

The image above explains BoS+ and how it forms, while highlighting an instance where an upside BoS+ formed following higher highs and higher lows.
A BoS+ resistance break requires higher highs and higher lows prior to the resistance point being closed over.

The image above explains BoS+ support break, while highlighting an instance where a downside BoS+ formed following lower highs and lower lows.
A BoS+ support break requires lower highs and lower lows prior to the support point being closed under.
Future BoS and CHoCH
Radi IQ also displays where the next BoS and CHoCH points are located.

The image above shows the feature in action. With this, traders will always know where the next key support/resistance breakpoints are before they actually occur.
Fair Value Gaps (FVG)
The indicator identifies gaps in the price where little or no trading occurred—known as fair value gaps. These gaps can act as temporary support or resistance and may indicate areas where the market is likely to correct. FVGs are displayed with clear color gradients that differentiate between upward and downward gaps.

The image above shows an identified upside FVG. In the image, the identified upside FVG acted as a support point for price.

The image above shows an identified downside FVG. In the image, the identified downside FVG acted as a resistance point for price.
Low Volume FVG
In addition to identifying trading FVGs - Radi IQ can also specifically detect low volume fair value gaps. Ideally, these fair value gaps will form inside a low volume node on a volume profile.
Low volume node FVGs are important because these are areas where very little trading occurred and is confirmable, indicating an imbalance in supply and demand. Since few trades took place there, the market often moves quickly through these zones when revisited, which can lead to rapid price changes. This "gap" in trading activity can serve as a signal for potential reversals or fast moves, offering opportunities to enter or exit positions based on expected market behavior.

The image above shows identified FVGs that formed on low volume.
Large Area FVGs
Radi IQ is also capable of filtering out “inconsequential” FVGs. With this, Radi IQ can be enabled to only mark FVGs that cover a wide price range.

The image above shows the feature enabled, and all identified FVGs formed with a wide price range.
Large Area FVGs and Low Volume FVGs Combined
Traders can also enable Radi IQ to only mark FVGs that form on low volume and have a wide price range - allowing traders to only identify the highest quality FVGs on the chart.
Order Blocks and Premium Discount Zones
Order Blocks: Radi IQ detects areas where large orders have previously been placed by institutional traders. These blocks can act as strong levels of support or resistance, and the indicator marks bullish and bearish order blocks with dedicated colors.
What is an order block?
Order blocks are clusters of orders that institutions have executed to enter or exit a market position. They typically form when there is a period of consolidation before a significant move. For example, the last bullish candle before a strong down move may indicate a supply order block, while the last bearish candle before a sharp rally might be considered a demand order block.
Why They Form:
Institutions don’t trade in small, sporadic amounts; they accumulate or distribute large volumes of an asset. To avoid slippage and minimize market impact, they execute these orders over a zone rather than at a single price point. This creates a recognizable “block” on the chart.
Order Block Identification Types
Strength Score
The “Strength Score” order block detection mode is a TradingIQ proprietary ranking system for identified order blocks.
Purpose
The purpose of the “Strength Score” ranking system is to determine the “strength” or significance of an order block and rate the zone’s likelihood to act as support/resistance when retested in the future.
The scoring system ranks from 0 - 10, with “0” indicating a “weak” score or low likelihood of acting as a key support/resistance level when retested in the future.
A rating of “5” indicates a “moderate” score, indicating that the order block has a moderate likelihood of acting as a key support/resistance level when retested in the future.
A rating of “10” indicates a “strong” score, indicating that the order block has a strong likelihood of acting as a key support/resistance level when retested in the future.
How It Works
The score is calculated by examining the price move following the formation of an order block. The stronger the price move after an order block forms - the higher the Strength Score.

The image above shows a bearish order block with a score of “5” identified on the chart. The order block successfully operates as a resistance point when retested.

The image above shows a bullish order block with a score of “5” identified on the chart. The order block successfully operates as a resistance point when retested.
Volume-Based
The volume-based order block detection method detects traditional order blocks, but goes one step further by identifying the highest concentration point of volume for the bar and drawing the order block around this concentration point.
Key features when using the volume-based order block detection method:

The image above shows the detection method in action.
Breaker Blocks
A breaker block is a specific type of order block that gains significance when price breaks through it and then often retests the level as a new area of support or resistance. Essentially, it’s a zone where, after the initial break, the previous level (which once acted as strong support or resistance) flips roles. For example, in an uptrend, if the price falls below a key support level, that level can become a breaker block and act as resistance if the price tries to move back up. Conversely, in a downtrend, a broken resistance level can serve as new support. Traders monitor breaker blocks because they often mark a shift in market sentiment and can provide potential entry or exit points once the market re-engages with these levels.

The image above shows a breaker block above price acting as resistance.

The image above shows a breaker block below price acting as support.
Rejection Blocks
A rejection block is a price area where the market shows a strong unwillingness to move beyond a certain level. This typically happens when price approaches a specific level but then is quickly rejected, leading to a bounce in the opposite direction. In other words, a rejection block forms when traders' orders create a barrier, causing the price to reverse rather than break through. Traders watch these areas closely, as they often signal a strong concentration of supply or demand that could provide potential entry or exit points for trades.

The image above shows both a verified upside rejection block acting as resistance, and an untested downside rejection block.
Rejection blocks are expected to function as strong support/resistance points when retested in the future.
Premium Discount Zones
Premium Discount Zones: These zones reflect areas where price is trading above (premium) or below (discount) a fair value range. They help traders gauge whether the current market price is relatively high or low compared to historical averages.
Premium Discount Zones account for recent swing highs and lows to calculate a fair value along with discount and premium prices over an intermediate time window.

The image above shows the premium and discount price zones in action.
Equal Levels
The indicator also tracks and highlights equal levels, which occur when the market repeatedly tests the same price levels. Equal levels can reinforce the significance of a support or resistance area and are represented by their own set of color markers.

The image above shows Radi IQ distinguishing equal highs and equal lows.
Equal Highs
When you see two or more highs that are approximately the same, it suggests that the market is repeatedly rejecting attempts to push higher. This signals a strong resistance level where sellers (or stop-hunters) are active.
Equal Lows
Similarly, consecutive lows at the same level indicate strong support, where buyers step in consistently, preventing further decline.
Strong Highs and Lows
Strong High
A strong high is a price level where the market repeatedly fails to push higher. Typically, it’s characterized by:
Strong Lows
Conversely, a strong low is a price level where the market repeatedly fails to break lower. It is identified by:

The image above shows Radi IQ detecting both a strong high and strong low, while the detected strong low acts as support when retested.
Liquidity Grabs
Liquidity grabs occur when the market temporarily moves to absorb liquidity, often triggering stop-loss orders and leading to rapid price movements. Radi IQ flags these events by identifying conditions where price moves against recent pivots, helping traders spot potential liquidity-related reversals or breakouts.

The image above shows Radi IQ identifying both an upside liquidity grab and a downside liquidity grab.
Upside Liquidity Grab (Bearish)
An upside liquidity grab happens when the price moves above a well-known resistance area or recent high. This move is often short-lived.
Many traders place stop-loss orders or pending buy orders just above resistance levels. Institutional players may intentionally push price upward to trigger these orders, thereby “grabbing” the liquidity available at that level.
Downside Liquidity Grab (Bullish)
A downside liquidity grab is the mirror image: the price briefly dips below a key support level or recent low.
Traders often place stop-loss orders or pending sell orders just below support levels. An intentional drop below this support can trigger these stops, allowing institutional players to capture liquidity.
Multi-Timeframe Analysis and Swings
By using data from different timeframes, Radi IQ offers a broader perspective on market trends. It highlights significant swing highs and swing lows, providing visual cues that indicate the market’s directional bias. This feature assists traders in identifying both short-term opportunities and long-term trends.

The image above shows Radi IQ detecting higher swings and lower swings.
IQ Meters / Fibometer
IQ Meters (Fibometers) are a proprietary TradingIQ tool that allows traders to easily identify the highs and lows of the current trend and where current price is relative to these points.

The image above depicts the IQ Meters—an exclusive TradingIQ tool designed to help traders evaluate trend strength and retracement opportunities.
When the lower timeframe Zig Zag IQ and the higher timeframe Zig Zag IQ are out of sync (i.e., one is uptrending while the other is downtrending, with no active positions), the meters display a neutral color as shown in the image.
The key to using these meters is to identify trend unison and pinpoint key trend retracement entry opportunities. Fibonacci retracement levels for the current trend are interlaced along each meter, and the current price is converted to a retracement ratio of the trend.
These meters can mathematically determine where price stands relative to the larger and smaller trends, aiding in identifying entry opportunities.
The top of each meter indicates the highest price achieved during the current price move.
The bottom of each meter indicates the lowest price achieved during the current price move.

When both the larger and smaller trends are in sync and uptrending, or when a long position is active, the IQ meters turn green, indicating uptrend strength.
When both meters are green, it indicates uptrend strength as both the higher timeframe trend and lower timeframe trend are in unison. Look for price to retrace to key fibonacci retracement levels during this time period.

When both trends are in sync and downtrending, or when a short position is active, the IQ meters turn red, indicating downtrend strength.
When both meters are red, it indicates downtrend strength as both the higher timeframe trend and lower timeframe trend are in unison. Look for price to retrace to key fibonacci retracement levels during this time period.
Summary
Radi IQ [TradingIQ] serves as a robust, data-driven tool for traders who seek a deeper understanding of market structure. By integrating internal and external analysis, fair value gap detection, order block identification, premium discount zoning, equal level tracking, liquidity grabs and much more into one indicator, it offers a multi-layered view of the market. This helps traders not only recognize potential turning points and areas of market stress but also manage risk more effectively and plan their trades with greater precision. The indicator’s clear visual representation and dynamic updates make it a practical addition to any trader’s toolkit.
Radi IQ is a comprehensive market structure indicator designed to provide traders with a detailed view of key price levels and market behavior. It combines several analytical methods—including internal and external structure analysis, fair value gaps, order blocks, breaker blocks, rejection blocks, premium discount zones, equal levels, directional liquidity grabs, and trend meters —to help users better understand areas of support and resistance, potential turning points, and liquidity events in the market.
Key Components and Their Functions
Market Structure Analysis
Internal and External Structure: The indicator evaluates market structure on two levels. The internal analysis focuses on immediate price action (e.g., recent support/resistance and swing points), while the external analysis uses a higher timeframe to provide context. This dual approach helps to confirm the strength of key levels by comparing short-term moves with the broader market trend.
Break of Structure (BoS) and Change of Character (CHoCH): These signals highlight moments when the market shifts its behavior. A BoS indicates that a previous level of support or resistance has been overcome, while a CHoCH signals a change in the market’s character. Both are marked clearly on the chart using distinct color codes.
Break of Structure + (BoS+) and Change of Character + (CHoCH+): These signals highlight moments when the market shifts its behavior and is confirmed by prior price action. A BoS + indicates that a previous level of support or resistance has been overcome, while price action achieves higher highs and higher lows (resistance break) or lower highs and lower lows (support break). CHoCH + signals a change in the market’s character when supported by prior price action - lower highs for a support break and higher lows for a resistance break.
BoS and CHoCH
The image above shows BoS and CHoCH identified on the price chart, and explains what each signifies.
A Break Of Structure (BoS) occurs when price decisively moves beyond a previously established support or resistance level. It indicates that the current trend or market pattern is being challenged, and the market may be ready to change direction.
A Change of Character (CHoCH) describes a shift in how the market behaves. A CHoCH occurs when, in an uptrend, a previously established support level breaks, or in a downtrend, a previously established resistance level breaks.
This break indicates that the market's typical structure is shifting, suggesting that the current trend may be losing its strength and that a reversal or a new trend could be developing.
CHoCH+
The image above explains CHoCH+ and how it forms, while highlighting an instance where a downside CHoCH+ formed following lower highs.
A Change of Character + (CHoCH+) describes a shift in how the market behaves that is supported by prior price action. For support breaks, price must form lower highs before breaking support.
The image above explains CHoCH+ for resistance breaks, while highlighting an instance where a resistance point broke that was supported by prior price action.
BoS+
The image above explains BoS+ and how it forms, while highlighting an instance where an upside BoS+ formed following higher highs and higher lows.
A BoS+ resistance break requires higher highs and higher lows prior to the resistance point being closed over.
The image above explains BoS+ support break, while highlighting an instance where a downside BoS+ formed following lower highs and lower lows.
A BoS+ support break requires lower highs and lower lows prior to the support point being closed under.
Future BoS and CHoCH
Radi IQ also displays where the next BoS and CHoCH points are located.
The image above shows the feature in action. With this, traders will always know where the next key support/resistance breakpoints are before they actually occur.
Fair Value Gaps (FVG)
The indicator identifies gaps in the price where little or no trading occurred—known as fair value gaps. These gaps can act as temporary support or resistance and may indicate areas where the market is likely to correct. FVGs are displayed with clear color gradients that differentiate between upward and downward gaps.
The image above shows an identified upside FVG. In the image, the identified upside FVG acted as a support point for price.
The image above shows an identified downside FVG. In the image, the identified downside FVG acted as a resistance point for price.
Low Volume FVG
In addition to identifying trading FVGs - Radi IQ can also specifically detect low volume fair value gaps. Ideally, these fair value gaps will form inside a low volume node on a volume profile.
Low volume node FVGs are important because these are areas where very little trading occurred and is confirmable, indicating an imbalance in supply and demand. Since few trades took place there, the market often moves quickly through these zones when revisited, which can lead to rapid price changes. This "gap" in trading activity can serve as a signal for potential reversals or fast moves, offering opportunities to enter or exit positions based on expected market behavior.
The image above shows identified FVGs that formed on low volume.
Large Area FVGs
Radi IQ is also capable of filtering out “inconsequential” FVGs. With this, Radi IQ can be enabled to only mark FVGs that cover a wide price range.
The image above shows the feature enabled, and all identified FVGs formed with a wide price range.
Large Area FVGs and Low Volume FVGs Combined
Traders can also enable Radi IQ to only mark FVGs that form on low volume and have a wide price range - allowing traders to only identify the highest quality FVGs on the chart.
Order Blocks and Premium Discount Zones
Order Blocks: Radi IQ detects areas where large orders have previously been placed by institutional traders. These blocks can act as strong levels of support or resistance, and the indicator marks bullish and bearish order blocks with dedicated colors.
What is an order block?
Order blocks are clusters of orders that institutions have executed to enter or exit a market position. They typically form when there is a period of consolidation before a significant move. For example, the last bullish candle before a strong down move may indicate a supply order block, while the last bearish candle before a sharp rally might be considered a demand order block.
Why They Form:
Institutions don’t trade in small, sporadic amounts; they accumulate or distribute large volumes of an asset. To avoid slippage and minimize market impact, they execute these orders over a zone rather than at a single price point. This creates a recognizable “block” on the chart.
Order Block Identification Types
Strength Score
The “Strength Score” order block detection mode is a TradingIQ proprietary ranking system for identified order blocks.
Purpose
The purpose of the “Strength Score” ranking system is to determine the “strength” or significance of an order block and rate the zone’s likelihood to act as support/resistance when retested in the future.
The scoring system ranks from 0 - 10, with “0” indicating a “weak” score or low likelihood of acting as a key support/resistance level when retested in the future.
A rating of “5” indicates a “moderate” score, indicating that the order block has a moderate likelihood of acting as a key support/resistance level when retested in the future.
A rating of “10” indicates a “strong” score, indicating that the order block has a strong likelihood of acting as a key support/resistance level when retested in the future.
How It Works
The score is calculated by examining the price move following the formation of an order block. The stronger the price move after an order block forms - the higher the Strength Score.
The image above shows a bearish order block with a score of “5” identified on the chart. The order block successfully operates as a resistance point when retested.
The image above shows a bullish order block with a score of “5” identified on the chart. The order block successfully operates as a resistance point when retested.
Volume-Based
The volume-based order block detection method detects traditional order blocks, but goes one step further by identifying the highest concentration point of volume for the bar and drawing the order block around this concentration point.
Key features when using the volume-based order block detection method:
- The top of the order block is anchored to the top of the highest volume concentration point of the bar
- The bottom of the order block is anchored to the bottom of the highest volume concentration point of the bar
- The total volume that went into creation of the order block is displayed on the chart
- The total volume of the order block is recorded as a percentage relative to the total volume for all order blocks on the chart
The image above shows the detection method in action.
Breaker Blocks
A breaker block is a specific type of order block that gains significance when price breaks through it and then often retests the level as a new area of support or resistance. Essentially, it’s a zone where, after the initial break, the previous level (which once acted as strong support or resistance) flips roles. For example, in an uptrend, if the price falls below a key support level, that level can become a breaker block and act as resistance if the price tries to move back up. Conversely, in a downtrend, a broken resistance level can serve as new support. Traders monitor breaker blocks because they often mark a shift in market sentiment and can provide potential entry or exit points once the market re-engages with these levels.
The image above shows a breaker block above price acting as resistance.
The image above shows a breaker block below price acting as support.
Rejection Blocks
A rejection block is a price area where the market shows a strong unwillingness to move beyond a certain level. This typically happens when price approaches a specific level but then is quickly rejected, leading to a bounce in the opposite direction. In other words, a rejection block forms when traders' orders create a barrier, causing the price to reverse rather than break through. Traders watch these areas closely, as they often signal a strong concentration of supply or demand that could provide potential entry or exit points for trades.
The image above shows both a verified upside rejection block acting as resistance, and an untested downside rejection block.
Rejection blocks are expected to function as strong support/resistance points when retested in the future.
Premium Discount Zones
Premium Discount Zones: These zones reflect areas where price is trading above (premium) or below (discount) a fair value range. They help traders gauge whether the current market price is relatively high or low compared to historical averages.
Premium Discount Zones account for recent swing highs and lows to calculate a fair value along with discount and premium prices over an intermediate time window.
The image above shows the premium and discount price zones in action.
Equal Levels
The indicator also tracks and highlights equal levels, which occur when the market repeatedly tests the same price levels. Equal levels can reinforce the significance of a support or resistance area and are represented by their own set of color markers.
The image above shows Radi IQ distinguishing equal highs and equal lows.
Equal Highs
When you see two or more highs that are approximately the same, it suggests that the market is repeatedly rejecting attempts to push higher. This signals a strong resistance level where sellers (or stop-hunters) are active.
Equal Lows
Similarly, consecutive lows at the same level indicate strong support, where buyers step in consistently, preventing further decline.
Strong Highs and Lows
Strong High
A strong high is a price level where the market repeatedly fails to push higher. Typically, it’s characterized by:
- Rejection: Price approaches the high but then reverses sharply, often leaving long upper wicks on the candlestick chart.
- Consolidation: Multiple bars might show highs that are very close in value (often termed "equal highs"), indicating a well-established resistance zone.
- Market Sentiment: This pattern suggests that sellers are actively defending that level, preventing further upward movement.
Strong Lows
Conversely, a strong low is a price level where the market repeatedly fails to break lower. It is identified by:
- Bounce Back: Price touches the low and then rebounds sharply, often leaving long lower wicks.
- Consistency: Multiple lows occur around the same level (sometimes referred to as "equal lows"), marking a solid support area.
- Market Sentiment: This indicates that buyers are stepping in at that level, absorbing selling pressure and supporting the price.
The image above shows Radi IQ detecting both a strong high and strong low, while the detected strong low acts as support when retested.
Liquidity Grabs
Liquidity grabs occur when the market temporarily moves to absorb liquidity, often triggering stop-loss orders and leading to rapid price movements. Radi IQ flags these events by identifying conditions where price moves against recent pivots, helping traders spot potential liquidity-related reversals or breakouts.
The image above shows Radi IQ identifying both an upside liquidity grab and a downside liquidity grab.
Upside Liquidity Grab (Bearish)
An upside liquidity grab happens when the price moves above a well-known resistance area or recent high. This move is often short-lived.
Many traders place stop-loss orders or pending buy orders just above resistance levels. Institutional players may intentionally push price upward to trigger these orders, thereby “grabbing” the liquidity available at that level.
Downside Liquidity Grab (Bullish)
A downside liquidity grab is the mirror image: the price briefly dips below a key support level or recent low.
Traders often place stop-loss orders or pending sell orders just below support levels. An intentional drop below this support can trigger these stops, allowing institutional players to capture liquidity.
Multi-Timeframe Analysis and Swings
By using data from different timeframes, Radi IQ offers a broader perspective on market trends. It highlights significant swing highs and swing lows, providing visual cues that indicate the market’s directional bias. This feature assists traders in identifying both short-term opportunities and long-term trends.
The image above shows Radi IQ detecting higher swings and lower swings.
IQ Meters / Fibometer
IQ Meters (Fibometers) are a proprietary TradingIQ tool that allows traders to easily identify the highs and lows of the current trend and where current price is relative to these points.
The image above depicts the IQ Meters—an exclusive TradingIQ tool designed to help traders evaluate trend strength and retracement opportunities.
When the lower timeframe Zig Zag IQ and the higher timeframe Zig Zag IQ are out of sync (i.e., one is uptrending while the other is downtrending, with no active positions), the meters display a neutral color as shown in the image.
The key to using these meters is to identify trend unison and pinpoint key trend retracement entry opportunities. Fibonacci retracement levels for the current trend are interlaced along each meter, and the current price is converted to a retracement ratio of the trend.
These meters can mathematically determine where price stands relative to the larger and smaller trends, aiding in identifying entry opportunities.
The top of each meter indicates the highest price achieved during the current price move.
The bottom of each meter indicates the lowest price achieved during the current price move.
When both the larger and smaller trends are in sync and uptrending, or when a long position is active, the IQ meters turn green, indicating uptrend strength.
When both meters are green, it indicates uptrend strength as both the higher timeframe trend and lower timeframe trend are in unison. Look for price to retrace to key fibonacci retracement levels during this time period.
When both trends are in sync and downtrending, or when a short position is active, the IQ meters turn red, indicating downtrend strength.
When both meters are red, it indicates downtrend strength as both the higher timeframe trend and lower timeframe trend are in unison. Look for price to retrace to key fibonacci retracement levels during this time period.
Summary
Radi IQ [TradingIQ] serves as a robust, data-driven tool for traders who seek a deeper understanding of market structure. By integrating internal and external analysis, fair value gap detection, order block identification, premium discount zoning, equal level tracking, liquidity grabs and much more into one indicator, it offers a multi-layered view of the market. This helps traders not only recognize potential turning points and areas of market stress but also manage risk more effectively and plan their trades with greater precision. The indicator’s clear visual representation and dynamic updates make it a practical addition to any trader’s toolkit.
Nota Keluaran
version -- 1.001Updated "CHoCH" and "BoS" naming scheme.
- "CHoCH" is now named "Trend"
- "BoS" is now named "BO Breakout"
Nota Keluaran
Version -- 1.1- Added Trend and Trend + market structure identification option
- Added text size option or key levels
- Added option to remove background color
- Added alerts to Radi IQ
New Alerts For Radi IQ
The alerts below are newly added for Radi IQ!
This is an ever expanding list; your feedback for additional alerts to add will be greatly appreciated!
- Inside FVG
- Inside Order Block
- Inside Breaker Block
- Inside Rejection Block
- Radi Trend Reversal
- Radi Base Hit
- Radi Strong High Trade
- Radi Strong Low Trade
- Structure Change
- Liquidity Grab
- New FVG Created
- New Order Block Created
- Price In Premium Zone
- Price In Discount Zone
Nota Keluaran
Version -- 1.2Added A+, B+, and C+ strategy setups and alerts.
Nota Keluaran
Version -- 1.201A+, B+, and C+ strategy setups for shorts will now work correctly.
Nota Keluaran
Version -- 1.202A+, B+, and C+ strategy setups for shorts will now display correctly.
Nota Keluaran
Version -- 1.3- Added better styling for A+, B+, C+ setups
- Added alert filter list in the settings for traders using the "Any Alert" option
Nota Keluaran
Version -- 1.301- Corrected alert list functionality. Disabled alerts will now no longer fire.
- Corrected issue causing more than the selected amount of strong levels to appear on the chart.
Nota Keluaran
Version -- 1.5New Feature: Neuro Trend
Neuro Trend leverages IQ technology (self-learning) to generate general direction trend signals, along with classic buy/sell signals.
The image above explains the color indications of Neuro Trend.
- Neuro Trend Blue (Uptrend) - Market Structure And Neuro Trend In Sync (Strong Bullish)
- Neuro Trend Red (Downtrend) - Market Structure And Neuro Trend In Sync (Strong Bearish)
- Neuro Trend Gray - Market Structure And Neuro Trend Out Of Sync
The image above shows classic Neuro Trend buy and sell signals.
- Red downwards-pointing triangles are classic sell signals.
- Blue upwards-pointing triangles are classic buy signals.
Nota Keluaran
Version -- 1.6- Change name of Neuro Trend to Radi MA
- Added Alerts Radi MA trend change signals
Nota Keluaran
-- version 1.7
Added option to show the Point of Control (POC) across a user-specified timeframe.
The image above shows Radi IQ displaying the session POC. The time period over which the POC is calculated is configurable in the settings.
Nota Keluaran
-- version 1.71- Improved efficiency for POC calculation
Tersedia dalam Ruangan Berbayar
Penunjuk ini hanya tersedia untuk pelanggan TradingIQ Premium. Sertai untuk mengaksesnya dan skrip lain oleh Trading-IQ.
Get Access To Our Tools: tradingiq.io
Subscribe For Daily Content: youtube.com/watch?v=Gx_cW29BUds
Subscribe For Daily Content: youtube.com/watch?v=Gx_cW29BUds
Penafian
Maklumat dan penerbitan adalah tidak bertujuan, dan tidak membentuk, nasihat atau cadangan kewangan, pelaburan, dagangan atau jenis lain yang diberikan atau disahkan oleh TradingView. Baca lebih dalam Terma Penggunaan.