OPEN-SOURCE SCRIPT
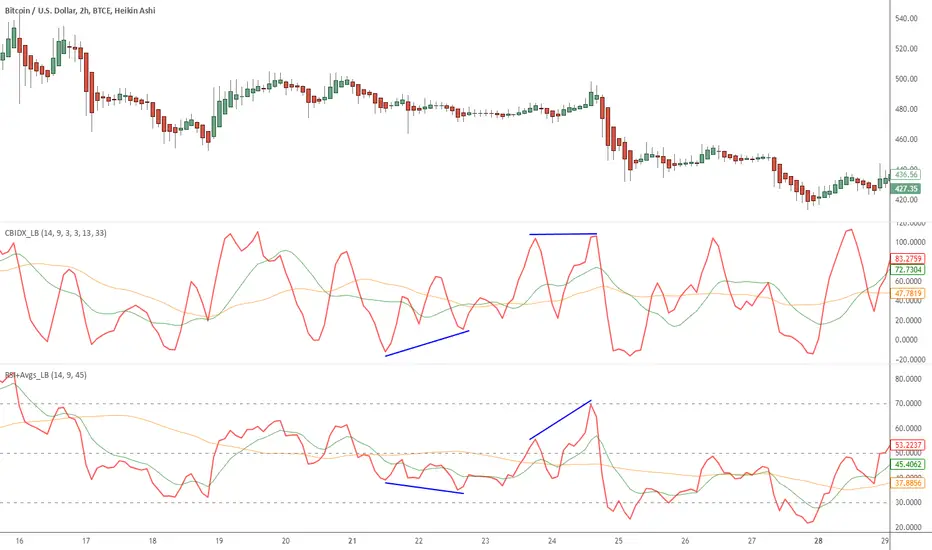
Indicators: Constance Brown Composite Index & RSI+Avgs
I am a big fan of Constance Brown. Her book "Technical Analysis for Trading Professionals" is an absolute classic (get the 2nd edition).
I have included here 2 of the indicators she uses in all her charts.
Composite Index
----------------------------------------
This is a formula Ms Brown developed (Cardwell may not agree!) to identify divergence failures with in the RSI. This also highlights the horizontal support levels with in the indicator area.
This index removes the normalization range restrictions in RSI. This means it is not bound with in 0-100 range. Also, this has embedded momentum calculation in it.
The fine nuances of this indicator are not documented well enough, if you find some good documentation, do let me know. Always use this with RSI (like the next one).
RSI+Avgs
----------------------------------------
This is plain 14 period RSI with a 9-period EMA and 45-period SMA overlaid.
Skrip sumber terbuka
Dalam semangat sebenar TradingView, pencipta skrip ini telah menjadikannya sumber terbuka supaya pedagang dapat menilai dan mengesahkan kefungsiannya. Terima kasih kepada penulis! Walaupun anda boleh menggunakannya secara percuma, ingat bahawa menerbitkan semula kod ini adalah tertakluk kepada Peraturan Dalaman kami.
List of my free indicators: bit.ly/1LQaPK8
List of my indicators at Appstore: blog.tradingview.com/?p=970
List of my indicators at Appstore: blog.tradingview.com/?p=970
Penerbitan berkaitan
Penafian
Maklumat dan penerbitan adalah tidak dimaksudkan untuk menjadi, dan tidak membentuk, nasihat untuk kewangan, pelaburan, perdagangan dan jenis-jenis lain atau cadangan yang dibekalkan atau disahkan oleh TradingView. Baca dengan lebih lanjut di Terma Penggunaan.