OPEN-SOURCE SCRIPT
Telah dikemas kini Smash + Proba + BF
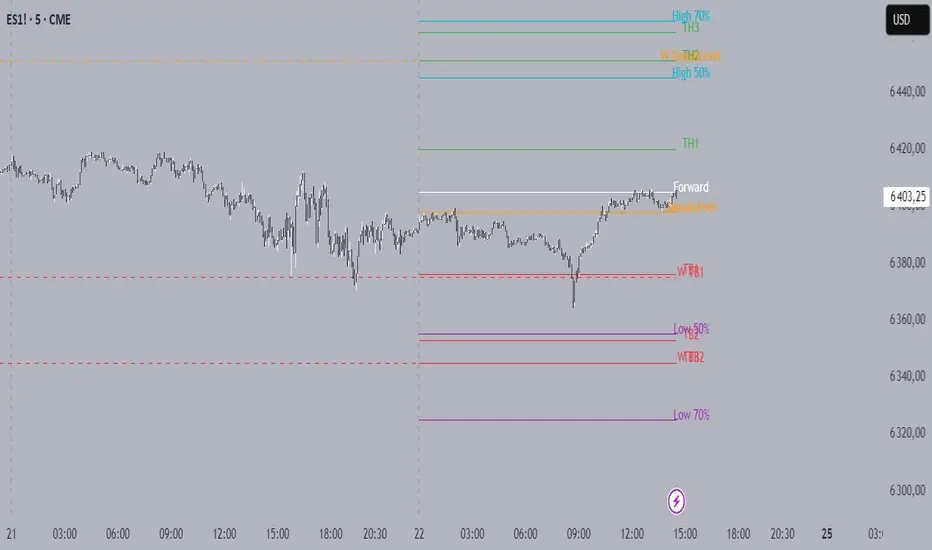
This script is designed to automatically display various levels that can be useful for trading.
These levels must be entered in the script as parameters in the form of lists separated by semicolons (";").
There are three groups of levels:

These levels must be entered in the script as parameters in the form of lists separated by semicolons (";").
There are three groups of levels:
- Smash: Levels provided in the Smashelito newsletter
- Proba: Probability levels (50% and 70%) of reaching certain price points, calculated using options data
- BF: Option-related levels provided by Krechendo Connect / BlackFlag
Example :
Nota Keluaran
A comprehensive multi-timeframe support and resistance indicator that displays key trading levels across daily and weekly timeframes.Features
Daily Levels (Solid Lines)
Smash Level: Key breakout/breakdown level (Orange)
Target High 1-3 (TH1-TH3): Upside targets (Green)
Target Low 1-3 (TB1-TB3): Downside targets (Red)
Weekly Levels (Dashed Lines)
Same structure as daily levels but displayed across the entire current week
Semi-transparent styling for clear distinction from daily levels
Probability Levels
High 70%/50%: Upper probability zones (Aqua)
Low 50%/70%: Lower probability zones (Purple)
Book Flow (BF) Levels
Call Resistance: Key call option resistance levels (Lime)
Put Support: Key put option support levels (Red)
Dominant Buy/Sell: Order flow dominance levels (Green/Red)
HVL (High Volume Levels): Both regular and 0DTE versions (Blue)
1D Min/Max: Daily range extremes (Yellow)
Gamma Wall: Critical gamma hedging levels (Aqua)
Input Format
Enter levels separated by semicolons (;) in the format: Level1;Level2;Level3;etc.
Usage
Perfect for traders who need to track multiple support/resistance levels across different timeframes and market dynamics. The indicator automatically updates and extends lines as new bars form, providing real-time level tracking with clear visual differentiation between daily and weekly levels.
Nota Keluaran
# Smash + Proba + BF Levels IndicatorA comprehensive multi-timeframe support and resistance indicator that displays key trading levels across daily and weekly timeframes.
## Features
### Daily Levels (Solid Lines)
- **Smash Level**: Key breakout/breakdown level (Orange)
- **Target High 1-3 (TH1-TH3)**: Upside targets (Green)
- **Target Low 1-3 (TB1-TB3)**: Downside targets (Red)
### Weekly Levels (Dashed Lines)
- Same structure as daily levels but displayed across the entire current week
- Semi-transparent styling for clear distinction from daily levels
### Probability Levels
- **High 70%/50%**: Upper probability zones (Aqua)
- **Low 50%/70%**: Lower probability zones (Purple)
### Book Flow (BF) Levels
- **Call Resistance**: Key call option resistance levels (Lime)
- **Put Support**: Key put option support levels (Red)
- **Dominant Buy/Sell**: Order flow dominance levels (Green/Red)
- **HVL (High Volume Levels)**: Both regular and 0DTE versions (Blue)
- **1D Min/Max**: Daily range extremes (Yellow)
- **Gamma Wall**: Critical gamma hedging levels (Aqua)
## Input Format
Enter levels separated by semicolons (;) in the format: `Level1;Level2;Level3;etc.`
## Usage
Perfect for traders who need to track multiple support/resistance levels across different timeframes and market dynamics. The indicator automatically updates and extends lines as new bars form, providing real-time level tracking with clear visual differentiation between daily and weekly levels.
Skrip sumber terbuka
Dalam semangat TradingView sebenar, pencipta skrip ini telah menjadikannya sumber terbuka, jadi pedagang boleh menilai dan mengesahkan kefungsiannya. Terima kasih kepada penulis! Walaupuan anda boleh menggunakan secara percuma, ingat bahawa penerbitan semula kod ini tertakluk kepada Peraturan Dalaman.
Penafian
Maklumat dan penerbitan adalah tidak bertujuan, dan tidak membentuk, nasihat atau cadangan kewangan, pelaburan, dagangan atau jenis lain yang diberikan atau disahkan oleh TradingView. Baca lebih dalam Terma Penggunaan.