Institutional Demand Supply Indicator
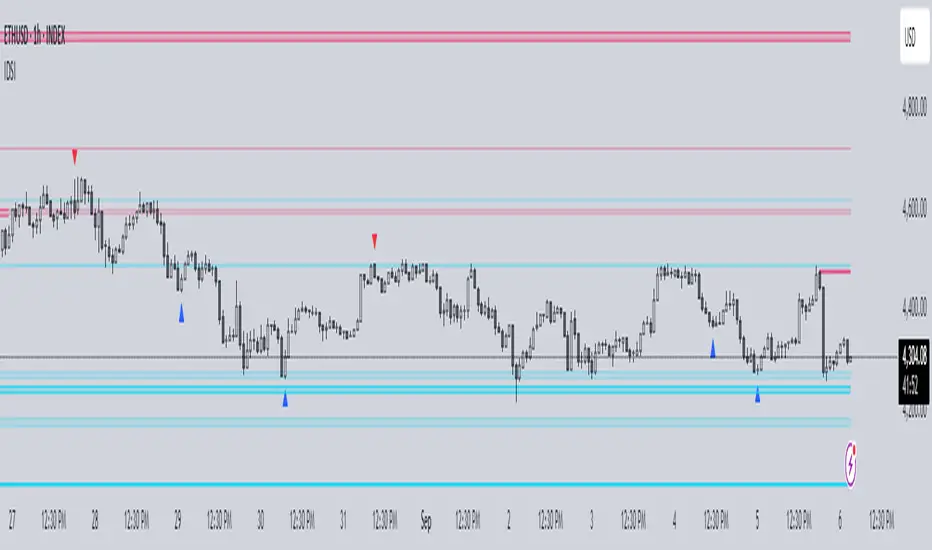
Institutional demand and supply zones are key areas on a price chart where large institutional traders, such as banks and hedge funds, place significant buy or sell orders. These zones often act as strong support or resistance levels due to the substantial volume of trades executed by institutions.
There are various ways to identify these areas of interest on the charts, but the main goal is to study the price movements, especially significant ones. Large financial entities tend to operate in the same price areas repeatedly. Instead of chasing price movements and risking counter moves, it's better to wait for the price to return to these areas, expecting that these entities will buy or sell there again.
INDICATOR SETTINGS:
1. High Probability Zones (HPZ) - High Probability Zones (HPZ) are demand and supply zones identified using advanced calculations to highlight the most relevant and significant areas. These zones have a higher probability of impacting price movements. Better to keep it turned On.
2. Zone Extension? - Extending zones can be useful for identifying areas that have already been retraced as these zones may continue to influence market dynamics despite the retracement.
3. Zone Type - This option lets you select the zone layout type. 4 options are given which are self explanatory.
4. Directional Candle Count - This option keeps a count of number of consecutive bullish / bearish candle that you would like to set as qualifying parameter for demand / supply zone. For Example - If you keep the number 1, the script will draw a demand or supply zone by just checking if 1 candle has met all the criteria's and calculations.
5. Zone Validity Percentage - You can set the percent change for the number of candles mentioned in point 4 above.
6. HPZ - Keep the number between 6 to 10. As you move the number up, less number of zones will be displayed.
7. Zone Count - You can adjust the number of visible demand and supply zones on the chart. Increase this number if you want to display more zones, or decrease it if the chart becomes too cluttered.
D I S P L A Y
1. Background Color Demand / Supply Zone - This is the background color of demand and supply zone.
2. Channel Color Demand / Supply Zone - This is the color of channel.
3. Channel Line Style - Choose between Solid, dotted or dashed.
4. Background Color Transparency - Choose the transparency of background color
5. Channel Line Width - Choose Channel line width between 1 to 4.
6. Channel Line Transparency - Choose Channel Line Transparency and keep it between 1 to 100.
Sometimes, a level may be breached on one timeframe, but that doesn’t mean the indicator is not working. To understand the price action better, switch to a different timeframe to check why that level was breached and why it found support at a different zone on another timeframe. Look at the 2 screenshots below.
The Daily SR Level is a leading tool designed specifically for intraday trading. It helps traders identify key reversal points throughout the day by marking support and resistance zones. This tool is particularly useful for day traders, though swing and positional traders may also benefit from it when focusing on shorter timeframes. It is important to note that this indicator is based solely on intraday data and does not work on daily, weekly or monthly timeframes.
The red zone represents resistance, where the price is likely to face selling pressure and reverse downwards, while the green zone marks support, where buying pressure may push the price back up. On average, price tends to stay within these zones 80% of the time, making these levels highly reliable for intraday trades.
The indicator calculates these zones using the average of previous days' price levels, allowing traders to forecast the current day's support and resistance more accurately. By using this tool, traders can better plan entries, exits, stops, and targets based on where the price is in relation to these key zones, offering an edge in risk management.
Minor code correction
Note: It is optimized for premium charts.
There were scenarios where after a new candle is formed all the levels were getting deleted.
Code Optimized.
1. User can select how many lines should be visible on the chart (Default is 14 instead of 13 lines earlier.) to make chart look cleaner.
2. You can still mark lines up to 13 levels by increasing "Number of Lines to Display"
2. Alerts added
3. HPZ levels value increased
Optimized code. Draws zone faster.
Now you can use volume as well along with price to find the Institutional Demand Supply Zones.
This will ensure better zones and more confidence in the zone to take trade.
Use the volume factor feature which is the Relative Volume of last 10 candle volumes. Keeping it above 1 ensures the Volume of the Zone is more than the average of last 10 candles.
2. Updated Code to Pinescript Version 6
indicator was not drawing zones on some indexes after the volume factor was implemented.
This was due to the fact the volume data was not available for those indexes.
Now with this fix, Indicator automatically checks for Volume data if it is available or not. if it is not, the indicator skips volume factor and draws the zone based on other Indicator Logics.
Small Bug Fix for The Gap (For Options)
This now shows fewer but more promising potential reversal signals.
1. A major update on Demand Supply Zones.
- It now also finds Orderblocks. You can choose between Demand and Supply or Orderblock or both at once.
2. A major update on Daily SR Levels.
- Logic has been updated with the fib levels of 0.382, 0.5 and 0.618.
3. Settings Completely Revamped
- Now looks more organized.
Skrip jemputan sahaja
Hanya pengguna disahkan oleh penulis boleh mengakses skrip ini. Anda perlu memohon dan mendapatkan kebenaran untuk menggunakannya. Keizinan selalunya diberikan selepas pembayaran. Untuk lebih butiran, ikuti arahan penulis di bawah atau hubungi Stable_Logic secara terus.
TradingView TIDAK menyarankan pembayaran atau penggunaan skrip kecuali anda mempercayai sepenuhnya penulis dan memahami bagaimana ia berfungsi. Anda juga boleh menjumpai alternatif sumber terbuka dan percuma yang lain di dalam skrip komuniti kami.
Arahan penulis
Penafian
Skrip jemputan sahaja
Hanya pengguna disahkan oleh penulis boleh mengakses skrip ini. Anda perlu memohon dan mendapatkan kebenaran untuk menggunakannya. Keizinan selalunya diberikan selepas pembayaran. Untuk lebih butiran, ikuti arahan penulis di bawah atau hubungi Stable_Logic secara terus.
TradingView TIDAK menyarankan pembayaran atau penggunaan skrip kecuali anda mempercayai sepenuhnya penulis dan memahami bagaimana ia berfungsi. Anda juga boleh menjumpai alternatif sumber terbuka dan percuma yang lain di dalam skrip komuniti kami.