IBD Market School [tradeviZion]
A comprehensive guide to configuring and using the IBD Market School indicator for TradingView
Introduction
The IBD Market School indicator is an advanced market analysis tool that implements Investor's Business Daily's methodology for identifying optimal trading opportunities. By tracking key market indexes and analyzing price and volume patterns, it provides actionable buy and sell signals based on the CANSLIM investment system.
The indicator offers a comprehensive set of features:
- Complete Signal System
- 10 primary buy signals (B1-B10)
- Additional buy-side indicators (HH - Higher High, ED - Expired Days)
- 14 sell signals (S1-S14)
- Index Rise 6% signal for Distribution/Stalling Day expiration
- Market Health Tracking
- Distribution Day detection and counting
- Stalling Day identification and validation
- Automatic 25-day signal expiration
- 6% price rise monitoring for signal clearing
- Market Condition Analysis
- Rally Day detection (major and minor)
- Follow-Through Day confirmation
- Dynamic market exposure management (0-100%)
- Power Trend analysis with multiple states
- Risk Management Features
- Circuit Breaker system for major declines
- Buy Switch system for exposure control
- Customizable volume analysis (Nasdaq/S&P 500)
- Distribution day clustering detection
- Visual Analysis Tools
- IBD-style candle display option
- Power Trend state visualization
- Signal line drawing system
- Customizable tooltips and alerts
Proper configuration of the indicator's settings is essential as it affects:
- Signal detection sensitivity and accuracy
- Market exposure calculations and adjustments
- Volume confirmation requirements
- Visual display of market conditions and signals
- Alert system behavior and notifications
This guide provides detailed explanations of each component and setting to help you optimize the indicator for your trading strategy while maintaining adherence to IBD's proven methodology.
📊 General Settings
This section controls the indicator's tooltip display, alert behavior, and candle visualization preferences.
The General Settings panel allows you to configure tooltip modes, alert types, and candle appearance.
Tooltip Display Mode
Select how detailed the tooltips should be when hovering over signals and indicators:
The three tooltip display modes: Simple (left), Detailed (center), and Market Analysis (right).
- Simple Mode
- Displays concise signal definitions
- Shows basic entry and exit conditions
- Focuses on essential trigger points
- Perfect for experienced traders
- Detailed Mode
- Provides in-depth explanations of each buy/sell signal
- Shows complete validation criteria and conditions
- Includes volume requirements and percentage thresholds
- Explains the context and significance of each signal
- Market Analysis Mode
- Focuses on broad market health metrics
- Shows market exposure percentage and trend
- Displays buy switch and power trend status
- Tracks distribution days and signal buffers
Note: Choose the tooltip mode based on your needs:
- Simple: Provides quick, essential information on signals for fast decision-making
- Detailed: Breaks down conditions for each buy/sell signal, ideal for users wanting in-depth explanations
- Market Analysis: Focuses on broad market health, including exposure, buy switch, distribution days, and trends
Market Exposure Alert System
The indicator alerts you when market exposure levels change, helping you adjust your positions accordingly.
Alert Types
- On Close (Recommended)
- Triggers only after bar closes
- More reliable signals as price action is confirmed
- Real-Time
- Triggers immediately when conditions are met
- Note: Signals may change by bar close
Setting Up Alerts
- Click the "..." (More) button on the indicator label "$tradeviZion - IBD Market School"
- Select "Add alert on $tradeviZion - IBD Market School..."
- In the Create Alert dialog:
Settings tab:
Verify the symbol and timeframe (e.g., NASDAQ:IXIC, 1D)
Condition: Select "tradeviZion - IBD Market School"
Alert function: Choose "Any alert() function call"
Expiration: Set to "Open-ended alert"
Alert name will auto-populate - Switch to Notifications tab:
Enable "Notify in app" for push notifications in the mobile app
Enable "Show toast notification" for on-screen alerts
Enable "Play sound" and customize duration (e.g., Thin, 10 seconds)
Optional settings:
Send email (requires profile settings configuration)
Webhook URL for POST requests
Send plain text for alternative email format - Click Create to activate the alert
Alert Messages
- Message format: "Market exposure change for [Symbol]: [Direction] Market exposure [Changed] from [Previous]% to [New]%"
- Example: "Market exposure change for
 IXIC: 📈 Market exposure reduced from 100% to 75%"
 - 📈 Arrow indicates exposure increase
- 📉 Arrow indicates exposure decrease
- Messages include previous and new exposure percentages
Note: These alerts specifically track changes in market exposure levels, helping you stay aligned with market conditions. They are essential for maintaining proper position sizing and risk management.
Chart Style Options
- IBD-style Candles
- Enable to match Investor's Business Daily chart style
- For MarketSmith style setup, right-click on chart and go to Settings
- Navigate to Symbol tab
- Uncheck Body, Borders, and Wicks
- Press Alt+R to restore chart view if zoom affects display
- To revert to original style, right-click on chart and go to Settings
- Navigate to Symbol tab
- Check Body, Borders, and Wicks
- Color Based on Previous Close
- Colors bars based on close vs. previous close
- When enabled, determines colors by comparing current close to previous close
- Use blue color for closes above previous
- Use pink color for closes below previous
📈 Market Exposure Table Settings
Configure how the market exposure information is displayed on your chart.
The Market Exposure Table Settings panel allows you to customize the appearance and layout of the market status display.
Layout Options
• Hide Table
Completely hides the market status display
• Basic (2 Columns)
Shows main indicators in two columns
Compact view without signal list
Ideal for minimalist chart view
• Detailed (2 Columns with Signals)
Displays main indicators plus signal panel
Shows Buy and Sell signals in separate columns
Provides comprehensive market overview
• Stacked (1 Column, Compact)
Vertical layout with single column
Most space-efficient option
Ideal for smaller chart windows
Color Settings
- Background: Dark gray background for the table
- Text: White text for general information
- Buy Signal: Green highlighting for buy signals
- Sell Signal: Red highlighting for sell signals
Additional Options
Show Trading Wisdom: Enable rotating trading messages
- Displays empowering trading messages
- Helps reinforce disciplined trading practices
- Updates every 5 bars with new wisdom
- Includes tooltips with comprehensive trading guidance
- Customizable yellow text color for messages
💹 Buy Signals Settings
This section controls the visibility and behavior of buy signals and related indicators.
The Buy Signals Settings panel allows you to configure signal visibility, volatility calculations, and visual appearance of buy signals.
Signal Display Options
- Buy Signals Display: Choose display mode
- Show Selected Signals
- Hide All
- Compact Signals
- Individual Signal Toggles
- Primary Buy Signals (B1-B10)
- Special Indicators (HH, ED)
Understanding Buy Signals
- B1: Follow-Through Day (FTD)
Buy on the initial FTD with volume higher than the previous day. You may use an FTD from an index other than theIXIC, but if you do, you must stay within that index for future Buy and Sell Signals. - B2: Additional Follow-Through
Buy on all additional follow-through days within 25 days from a rally day that closes above the low of the initial follow-through day. - B3: Low Above EMA21
Buy on an up or flat day when the intraday low is at or above the EMA21. Note: Once you have a B3 or B4, you can't have another until it is reset by an S5.
Special Buy Indicators
- HH: Higher High (No FTD after Rally)
Triggers when current close exceeds highest point since last confirmed rally. Must not have a Follow-Through Day (FTD). Buy switch turns on when close exceeds last rally's high and turns off if close drops below that high. - ED: Expired Days
Tracks Distribution and Stalling days that have aged out. Days are tracked for a specific trading period and expired days are removed from the count.
Index Rise Settings
- Index Rise 6% from DD & SD
Toggle to enable/disable monitoring of price rises above Distribution and Stalling Days. Default value of 6% (adjustable) for monitoring rises above these days.
Understanding Index Rise
This feature tracks significant market recoveries by monitoring when the index rises substantially above Distribution Days (DD) or Stalling Days (SD). When the index rises 6% or more above the closing price of any DD or SD, it indicates a strong market recovery. This is an important signal because it helps identify when the market has shown enough strength to potentially overcome previous distribution periods. When triggered, this signal reduces the distribution day count, effectively acknowledging that the previous distribution pattern may no longer be as relevant due to the market's strong recovery.
B1 Signal Configuration
Volatility Settings
- B1 Auto Volatility: Calculates FTD price requirement based on 200-day volatility
- B1 Manual Volatility: Fixed value (default 1.245) when auto is disabled
Visual Settings
- Label Size: Small (options: Tiny, Small, Normal, Large)
- Signal Color: Light green background for buy signals
- Text Color: Customizable text color for signal labels
Important Notes
- Signal visibility affects both chart display and calculations
- Auto volatility is recommended for most users
- Manual volatility should only be adjusted by experienced users
- Visual settings apply to all enabled buy signals
Confirmation Rules
Price Requirements
- Follow-Through Day (B1) thresholds based on 200-day volatility:
Below 0.4% volatility: 0.7% gain required
0.4% to 0.55% volatility: 0.85% gain required
0.55% to 1% volatility: 1% gain required
Above 1% volatility: 1.245% gain required - EMA Breaks (S5/S6): 0.2% threshold below 21 EMA
- Downside Reversal (B9): 1.75% high-to-low spread required
Volume Requirements
- Distribution Days: Volume > previous day, with -0.20% or more price decline
- Stalling Days: Volume ≥ 95% of previous day
- Follow-Through Days (B1/B2): Volume > previous day
- Accumulation Days (B7): Volume > previous day, close in upper 25% range
Sell Signals Settings
This section controls the visibility and behavior of sell signals and market weakness indicators.
The Sell Signals Settings panel allows you to configure signal visibility and visual appearance of sell signals and market health indicators.
Signal Display Options
- Sell Signals Display: Dropdown with options to control signal visibility:
Show Selected Signals
Hide All
Compact Signals - Individual Signal TogglesPrimary Sell Signals: S1-S14 and CB (Circuit Breaker)
Market Health Indicators: - Distribution Days (DD): Indicative of institutional selling. Occurs when:
Market closes down by at least 0.2%
Volume greater than or equal to prior day
Tracked for 25 trading days - Stalling Days (SD): Sign of heavy volume without upside progress. Occurs when:
Market at/near new highs
Closes with small gain (0% to 0.4%)
High volume in lower half of day's range
Understanding Sell Signals
- S1: Follow-Through Day Undercut
Sell if the index closes below the low of the initial follow-through day. - S2: Failed Rally Attempt
Sell if the index undercuts the major low of the rally attempt. Market exposure is reduced to zero and the Buy Switch is turned off. - S2ml: Minor Low Undercut
Minor Low undercut of rally attempt. Market exposure is reduced by two. This does not turn off the Buy Switch. - S3: Full Distribution Minus One
Sell after the distribution count increases to one less than the full distribution count. - S4: Full Distribution
Sell after reaching the full distribution count. - S5: Break Below EMA21
Sell if the index closes 0.2% or more below the EMA21. Note: Once you have an S5, S6, or S7, you can't have another until it is reset by a B3. - S6: Overdue Break Below EMA21
Sell if the index closes down 0.2% or more below the EMA21 after 30 days have passed since the last B3 without triggering an S5. - S7: Trending Below EMA21
Sell after S5 on the 5th consecutive day that the high is below the EMA21 and a down day. - S8: Living Below EMA21
Sell after S5 on the 10th and every 5th consecutive day after that (15th, 20th, 25th, etc.) that the high is below the EMA21. - S9: Break Below 50-Day MA
Sell if the index closes below the 50-Day Moving Average. Triggers only if a B6 signal was previously printed. - S10: Bad Break
Sell if the close is down 2.25% or greater in the bottom 25% of the range. Close below the MA50 or intraday high below EMA21. - S11: Downside Reversal
Sell after a Downside Reversal Day, which occurs with:
New High within 13 weeks
Close in bottom quartile of range
Close Down for the day
Spread of 1.75% or greater - S12: Lower Low
Sell after closing below the last marked low as defined by MarketSmith. - S13: Distribution Cluster
Distribution and stalling days increase to four up to eight days within a rolling eight-day period. - S14: Break Below Higher High
Sell after closing below the last marked high that printed a B8 (Higher High). - CB: Circuit Breaker
Triggers when the index drops 10% from the highest high since the FTD (B1) and falls 5% or more below the 50-Day MA intraday.
Buy/Sell Undercut Lines
This section controls the visibility and appearance of important price level lines on your chart.
The Buy/Sell Undercut Lines panel allows you to configure which signal lines are displayed and their visual appearance.
Line Visibility
- Buy Signal Lines:
B8 Line: First high above the last pivot high
HH Line: Close above the prior high since last confirmed rally without FTD
- Sell Signal Lines:
- S1 Line: Close below the initial follow-through day
- S2 Line: Undercut of major low
- S2ml Line: Minor low undercut
- S12 Line: Close below last marked low
- S14 Line: Close below last marked high
- Color Settings:
B8: Green (Buy signal)
HH: Green (Buy signal)
S1: Red (Sell signal)
S2: Red (Sell signal)
S2ml: Orange (Modified sell signal)
S12: Purple (Pivot low signal)
S14: Blue (Close below pivot)
- Line Style: Dashed (options: solid, dotted, dashed)
- Line Width: 1 (adjustable)
The Rally Signal Settings panel allows you to configure Rally Day detection and visualization.- Rally Day:
Toggle to enable/disable Rally Day signals. These mark the beginning of potential market uptrends when the market closes higher than the previous day, following a significant decline. - Visual Settings:
Label Size: small (options: tiny, small, normal, large)
Background Color: Customizable background for Rally Day labels
Text Color: Customizable text color for Rally Day labels - Distribution Day Settings:
Use Manual FullDDcount: Option to manually set the minimum combined number of Distribution and Stalling Days
Count Value: Default is 6 days (adjustable when manual mode is enabled)
This setting determines how many Distribution/Stalling Days are required to trigger a new rally
The Pivot Point Settings panel allows you to configure the display of high/low points and percentage changes between pivots.
Display OptionsDisplay H/L Points
Toggle to show or hide pivot levels (high and low points) on the chart
%Change
Toggle to display percentage changes between pivot points
Color Settings- Positive % Color: Blue (customizable) - Used for positive percentage changes
- Negative % Color: Pink (customizable) - Used for negative percentage changes
- Decimal Places: Set the number of decimal places (default: 2) for:
Pivot point price levels
Percentage change calculations
This section controls how Power Trend information is visualized on your chart.
The Power Trend Settings panel allows you to configure how trend states are displayed and customize their visual appearance.
Example of Power Trend visualization showing both boxes (green background) and trend lines. The boxes indicate trend state while lines show trend transitions.
Display Options- Show Power Trend Line: Display trend states as lines on the chart
- Show Boxes: Display trend states as boxes
- Show Background: Display trend states as background colors
- On: Light green - Full power trend active
- Resume: Light green - Power trend resuming
- Off: Gray - Power trend inactive
- With Floor: Yellow - Under pressure with support
- No Floor: Orange - Under pressure without support
- Line Width: Set line thickness (default: 1)
- Line Offset: Adjust line position (default: 5)
- Text Align: Set text alignment (left, center, right)
- Text Position: Set vertical position (top, middle, bottom)
- Size: Set box size (tiny, small, normal, large)
- Color: Customize box background color
- Full Power (On)
Represents strongest market condition with maximum exposure of +7
Base maximum exposure of 5 plus 2 buffer signals
Buffer allows maintaining high exposure during normal pullbacks
2 sell signals reduce count from 7 to 5 without affecting base
Indicates very healthy market that can absorb normal profit-taking - Resume State
Shows successful market recovery after pressure period
Requires 10+ days without S2 minor, S9, or S13 signals
Must reestablish all initial strength conditions
Maintains same benefits as Full Power (+7 max, +2 floor)
Shows as light green in visualization - Under Pressure With Floor
First warning stage triggered by S2 minor or S13 signals
Reduces maximum exposure to +5
Maintains minimal protection with +1 floor
Suggests defensive positioning while keeping core positions
Shows as yellow in visualization - Under Pressure No Floor
Severe warning stage triggered by S9 signal
Maintains +5 maximum exposure but removes floor protection
Indicates higher risk of continued market decline
Requires careful position management
Shows as orange in visualization - Power Trend Off
Triggered by EMA/MA crossdowns with declining price
Can also be activated by S2 or Circuit Breaker signals
Maximum exposure limited to +5 with no buffer signals
Suggests focus on capital preservation
Shows as gray in visualization
- Each state enforces strict exposure limits with automatic floor and ceiling adjustments
- Power Trend can activate Buy Switch when entering Full Power state
- Restraint Rule limits exposure to +2 until significant progress or B4 signal when starting from zero exposure
- State transitions immediately update exposure limits and Buy Switch status
- Distribution Cluster (S13) can move Power Trend to Under Pressure With Floor state
- System maintains exposure floors to prevent panic selling while allowing flexibility below floor levels
The Weekly SMAs Settings panel allows you to configure the weekly moving averages display and calculations.
- SMA 1: 10 periods (enabled), Red
Length: 10
Optional EMA toggle
Width: 1 - SMA 2: 20 periods, Pink
Length: 20
Optional EMA toggle
Width: 1 - SMA 3: 30 periods, Green
Length: 30
Optional EMA toggle
Width: 1 - SMA 4: 40 periods (enabled), White
Length: 40
Optional EMA toggle
Width: 1
The SMAs Settings panel allows you to configure the daily moving averages display and calculations.
- MA 1: 10 periods, Optional EMA, Pink
Length: 10
Optional EMA toggle
Width: 1 - MA 2: 21 periods (enabled), EMA, Green
Length: 21
EMA enabled
Width: 1 - MA 3: 50 periods (enabled), SMA, Red
Length: 50
EMA disabled
Width: 1 - MA 4: 200 periods (enabled), SMA, White
Length: 200
EMA disabled
Width: 1
This section controls volume data sources for market analysis. Proper volume settings are crucial for confirming market signals and analyzing institutional participation.
The Volume Settings panel allows you to configure volume data sources and custom ticker options for accurate market analysis.
Important Volume Source Information- TradingView's default volume data differs from IBD's Yahoo Finance data source
- Current default settings (IXIC and TVOL) provide the most accurate results compared to IBD signals
- Volume differences between TradingView and IBD are expected due to different data sources
- Custom ticker options are provided for future compatibility with Yahoo Finance volume data
- Nasdaq Volume Settings
Default Source:IXIC (Nasdaq Composite Index)
Custom Ticker Option: USI:TVOL.NQ
Enable custom source by checking "Use Custom Nasdaq Ticker?"
Note: Custom ticker must be price-based for accurate volume analysis - S&P 500 Volume Settings
Default Source: TVOL (S&P 500 Total Volume)
Custom Ticker Option: USI:TVOL.NY
Enable custom source by checking "Use Custom S&P 500 Ticker?"
Note: Custom ticker must be price-based for accurate volume analysis - Volume Analysis Impact
Used for Distribution Day confirmation
Required for Follow-Through Day validation
Helps identify institutional buying/selling
Critical for Stalling Day detection
- Keep default settings for most accurate current results
- Only use custom tickers if you have confirmed price-based volume sources
- Be aware that volume-based signals might slightly differ from IBD due to data source differences
- Future updates may add Yahoo Finance volume compatibility
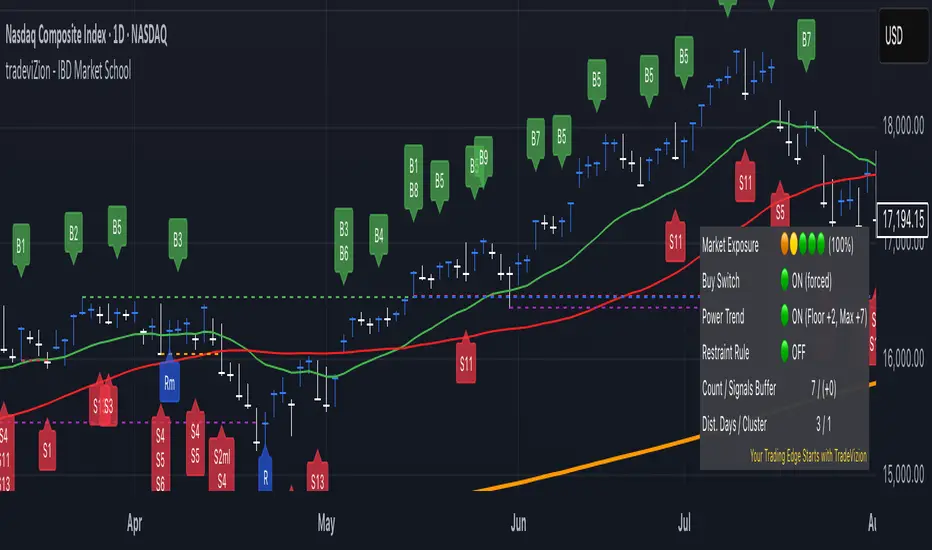
The Market Status Table provides a real-time visual overview of current market conditions and signal status. Users can customize the table's appearance through the Market Exposure Table Settings.
The Market Status Table can be displayed in three different layouts: Basic (left), Detailed (center), and Stacked (right).
Layout Options- Hide Table
- Completely hides the market status display
- Basic (2 Columns)
- Shows main indicators in two columns
- Compact view without signal list
- Ideal for minimalist chart view
- Detailed (2 Columns with Signals)
- Displays main indicators plus signal panel
- Shows Buy and Sell signals in separate columns
- Provides comprehensive market overview
- Stacked (1 Column, Compact)
- Vertical layout with single column
- Most space-efficient option
- Ideal for smaller chart windows
• Market Exposure
Displayed as colored dots: 🟠 🟢 🟢 🟢 🟢
Shows current exposure level (0-100%)
(⚪ ⚪ ⚪ ⚪ ⚪): 0% exposure
(🟠 ⚪ ⚪ ⚪ ⚪): 30% exposure
(🟠 🟡 ⚪ ⚪ ⚪): 55% exposure
(🟠 🟡 🟢 ⚪ ⚪): 75% exposure
(🟠 🟡 🟢 🟢 ⚪): 90% exposure
(🟠 🟡 🟢 🟢 🟢): 100% exposure
• Key Status Indicators
Buy Switch: Shows ON (forced) or OFF status
Power Trend: Displays current state with floor and maximum values
Restraint Rule: Indicates ON or OFF status
Count / Signals Buffer: Shows current count and available buffer (e.g., "7 / (+0)")
Dist. Days / Cluster: Displays distribution day count and cluster status (e.g., "1 / 0")
• Signal Panel (Available in Detailed layout)
Lists all active Buy and Sell signals
Highlighted signals indicate currently active conditions
Green highlighting shows confirmed signals
Provides quick reference for all available signals
Status Indicator Colors
🟢 indicates "ON" or positive conditions (e.g., Buy Switch ON, Power Trend Full Power)
🟡 indicates "Under Pressure" or caution (e.g., Power Trend Under Pressure With Floor)
🟠 indicates "Under Pressure No Floor" or increased caution
🔴 indicates "OFF" or negative conditions (e.g., Buy Switch OFF, Power Trend OFF)
• Signal Colors
Green background for buy signals
Red background for sell signals
Black text on signal backgrounds for better visibility
• Number Formats
Count / Buffer signals shown as "7 / (+2)"
Distribution Days / Cluster count shown as "1 / 0"
Exposure percentage shown with dots (e.g., "90%")
Trading Wisdom - Market Risk Management"The key to successful trading is not just knowing when to enter, but managing your exposure based on market health. Always check two critical indicators before any trade:
1. Market Exposure Levels- 100% (5 dots): Full positions in strong market
- 90% (4 dots): Slightly reduced positions
- 75% (3 dots): Moderate positions, more cautious
- 55% (2 dots): Half positions only
- 30% (1 dot): Small positions only
- 0% (0 dots): Stay in cash
2. Distribution Days Risk Levels- 1-2 Days: Normal market behavior
- 3 Days: Caution - reduce new positions
- 4+ Days: High risk - defensive positioning
- 5-6 Days: Consider moving to cash
Remember: It's better to miss an opportunity than to catch a falling market. Let the Market Exposure Table be your guide to smart position sizing."
Pro Tip: Make checking these two indicators part of your daily routine. They're your first line of defense against major drawdowns.
Conclusion
The IBD Market School indicator brings William O'Neil's proven methodology to TradingView, providing a comprehensive system for market analysis and risk management. This tool automates the complex task of tracking market signals while maintaining strict adherence to IBD's time-tested principles.
Key Features- Follows IBD's core methodology for identifying market direction
- Automates tracking of Distribution Days, Follow-Through Days, and market signals
- Provides clear market exposure guidance through the Power Trend system
- Helps maintain discipline through systematic Buy Switch control
- Offers multiple layers of risk management
- Always check Market Exposure and Distribution Day count before making trades
- Let the Buy Switch guide your market participation
- Follow Power Trend states for proper position sizing
- Use the default volume settings for most accurate signal generation
- Monitor all confirmation rules for proper signal validation
Remember: This indicator is designed to replicate IBD's methodology as closely as possible within TradingView's environment. While it automates signal detection and exposure management, successful trading still requires discipline, patience, and strict adherence to risk management principles.
"The goal is not to be right about the market - it's to make money by following the market's signals and managing risk." - S1 Line: Close below the initial follow-through day
Release Date: 15 January 2025
Enhancements
- Fixed an issue where the Rally Day was not generated on a full Distribution count when the Buy Switch was off.
- Rally Day for major and minor lows: Removed Buy Switch dependency.
- Improved Restraint Rule and B7 signal behavior to align with B1 manual volatility settings.
New Scenario Implementation
Added logic for S7 (Trending Below the 21-day MA) and S8 (Living Below the 21-day MA) signals following a Follow-Through Day:
- S7 Sell Signal is only acted upon after a B3 has occurred, following a B1 (Follow-Through Day).
- S8 Sell Signal is only acted upon after a B3 has occurred, following a B1 (Follow-Through Day).
Bug Fixes
- Corrected Higher High (HH) positioning on the chart.
- Refined Buy Switch behavior: now deactivates when the price closes below the initial activation price in case of a Higher High (HH).
Release Date: 18 February 2025
Summary of Changes
- Improved alert system with detailed market analysis
- Changed default volume source to match IBD standards
- Added option for pre-close alerts
Alert Example
📋 Total 2 signals for IXIC today:
• S3: Sell after 5 distribution days.
• Distribution Day: Market down 0.20%+ with volume higher than the previous day.
⏸ Market Exposure: 100%
📊 Count / Signals Buffer: 6 / (+0)
💡 Buy Switch: 🟢 ON (forced)
⚡ Power Trend: 🟢 ON (Floor +2, Max +7)
🛑 Restraint Rule: 🟢 OFF
🧮 Total Distribution Days: 5 / 6
📉 Percentage Change: -0.44%
📊 IBD Volatility: 0.263%
📈 FTD Price Req.: 0.7% (Auto)
📈 Gain from FTD: 2.48%
This update improves the alert system and changes the default volume source to better align with IBD's Market School methodology, while maintaining the core principles of the CAN SLIM strategy.
Note: The level of detail in signal descriptions within alerts depends on the user's selected tooltip display mode (Simple or Detailed) when creating the alert.
Release Date: 18 February 2025
Bug Fix
- Fixed an issue where the restraint rule was not being turned off when the buy switch was turned off while the restraint rule was in force
Release Date: 17 March 2025
What's New
Enhanced Alert System
- Added new "Each Bar" option to the Alert Mode settings
- Alert Mode now offers three options: "Pre-Close Only", "Close Only", and "Each Bar"
- Added additional information for the market analysis when an alert is generated, providing more comprehensive market context with each alert
Update Date: March 26, 2025
What's New:
- Added Option Expiration & Quadruple Witching Day Handling: Special volume comparison for FTD signals after option expiration days
Improvements:
- Added Volume Comparison Options:
• Default: Compare volume with the previous day
• Ignore Option Expiration: Compare with average volume of prior week (excluding Fridays) when previous day was an option expiration day
• Ignore Quadruple Witching: Compare with average volume of prior week (excluding Fridays) when previous day was a quadruple witching day - Added Apply Comparison Filter to:
• FTD Only: Apply special volume handling only to Follow-Through Days
• All Signals: Apply to all volume-related signals (B1, B2, B7, Distribution Days and Stalling Days)
Technical Details:
- Volume Comparison Logic: When a signal (FTD, B2, B7, DD or SD) occurs after Option Expiration or Quadruple Witching days, volume is compared to the average volume of the prior week (excluding Fridays) instead of the previous day
- Default Settings: Quadruple Witching day handling is applied by default with "FTD Only" option to align with IBD methodology
A key addition in Version 6.0 is the special handling of volume for Follow-Through Days following Option Expiration or Quadruple Witching days. The indicator will now ignore volume on the day of option expiration Fridays by comparing with the average volume of the prior week (excluding Fridays). This allows the indicator to correctly identify important signals like the B1 on March 24, 2025, matching IBD's own analysis.
Update Date: April 02, 2025
What's New:
- Fixed B5 and S8 Signal Bug: Removed erroneous requirement for consecutive days above EMA21, correctly implementing the IBD Market School seminar guidance
- Improved Signal Labeling: Added special labeling "(B1)" for Follow-Through Days occurring after option expiration or quadruple witching days, making it easier to identify these special cases
Update Date: July 29, 2025
Hello traders! I’m excited to share the latest upgrade to your trusted IBD Market School indicator. This release includes meaningful improvements to volume handling, signal precision, and user customization, all based on the official IBD Market School workbook guidelines.
What’s New in Version 8.0
Refined Volume Logic and Customization
- Default volume sources updated for common tickers: IXIC volume for Nasdaq and SPX volume for S&P 500 provide the best accuracy per in-depth analysis versus IBD’s workbook standards.
- You can now override the volume source for any chart symbol with a custom volume ticker you specify.
- Option to select whether the custom source is treated as actual volume data or price (close price) data, accommodating volume proxies like TVOL.
Signal Logic Enhancements
- The B5 (Living Above EMA21) and S8 (Living Below EMA21) signals have been fully reworked to 100% match the IBD Market School workbook logic.
- Introduced a new signal for the rare Heavy Volume Without Further Price Progress Up (HVWPPU) stalling day, labeled as "H".
- Improved S4 signal logic to avoid repeated signals on the same distribution day count.
- Updated Higher High (HH) buy switch logic to properly handle turning off the buy switch and clearing buffered signals in alignment with workbook examples.
Trailing Low Logic and Late B1 Signal
- Added a trailing low mechanism that activates when no Follow-Through Day (B1) occurs within 25 days of a rally low, using the new trailing low as a reference point for key signals (B1, B2, S1, S2).
- B1 signal can now print even if the Follow-Through Day occurs late - after 25 days from the rally day - covering rare but important market scenarios.
Enhanced User Experience
- Clear and informative tooltips added for rare or complex scenarios: B9 and B10 signals printed from lows before the buy switch is on, and S7/S8 signals appearing after B1 but before B3, emphasizing their proper interpretation per IBD rules.
This update sharpens the indicator’s fidelity to IBD’s time-tested methodology, giving you a more powerful and flexible tool for navigating complex market conditions.
Thank you again for trusting TradeVizion. As always, your feedback drives continuous improvement. Please keep sharing your experiences and suggestions!
Happy trading!
Update Date: July 31, 2025
Bug Fix - B5 & S8 Signal Detection
- Fixed B5 signal missing when >14 days pass since B3. Now checks every 5 consecutive days above EMA21 for first B5.
- Fixed S8 signal missing when >14 days pass since S5. Now checks every 5 consecutive days below EMA21 for first S8.
Skrip jemputan sahaja
Only users approved by the author can access this script. You'll need to request and get permission to use it. This is typically granted after payment. For more details, follow the author's instructions below or contact TradeVizion directly.
TradingView does NOT recommend paying for or using a script unless you fully trust its author and understand how it works. You may also find free, open-source alternatives in our community scripts.
Arahan penulis
For our premium indicators! whop.com/tradevizion/
Penafian
Skrip jemputan sahaja
Only users approved by the author can access this script. You'll need to request and get permission to use it. This is typically granted after payment. For more details, follow the author's instructions below or contact TradeVizion directly.
TradingView does NOT recommend paying for or using a script unless you fully trust its author and understand how it works. You may also find free, open-source alternatives in our community scripts.
Arahan penulis
For our premium indicators! whop.com/tradevizion/