PROTECTED SOURCE SCRIPT
Accumulated Net Value
The Concept:
Accumulated Net Value (ANV) is an indicator that gauges buying/selling strength by looking at whether the closing price is closer to the high or the low. It’s like a tug of war - if buyers are more dominant, then the closing price should be closer to the high; and if sellers are more dominant, then the closing price should be closer to the low.
Additional adjustments are implemented to address price gaps. The indicator first compares the high and low of the current bar with the previous bar, and then use the higher high/lower low among the current and previous bars to calculate the distance from the closing price.
Price is only part of the equation. We know that volume is also an important factor when considering the strength of buyers and sellers. The ANV indicator takes volume into account by multiplying volume with the difference between the closing price and the high or low (depending on which one is more dominant). This generates the ANV for one bar, where such one-bar ANV will have a positive value during buyer-dominant conditions, and a negative value during seller-dominant conditions.
Since ANV for only one bar can be quite choppy, this indicator further adds the ANV of N bars together to get the final ANV signal, and then applies a simple moving average (SMA) to it.
The Variables:
This indicator has two inputs: (1) N bars of Accumulation, and (2) SMA Length.
N bars of Accumulation determines how many bars of ANV values are added together. SMA Length determines the length of SMA applied to the final ANV.
For daily charts, I use “5” or “10” for N bars of accumulation and “20” for SMA length.
For weekly charts, I use “4” for N bars of accumulation and “10” for SMA length.
The user will have to do some testing to see which numbers suit their needs. Smaller values are more sensitive and move faster, but show more choppiness and false signals. Larger values tend to be more reliable, but are slow to react to price movements.
The Signals:
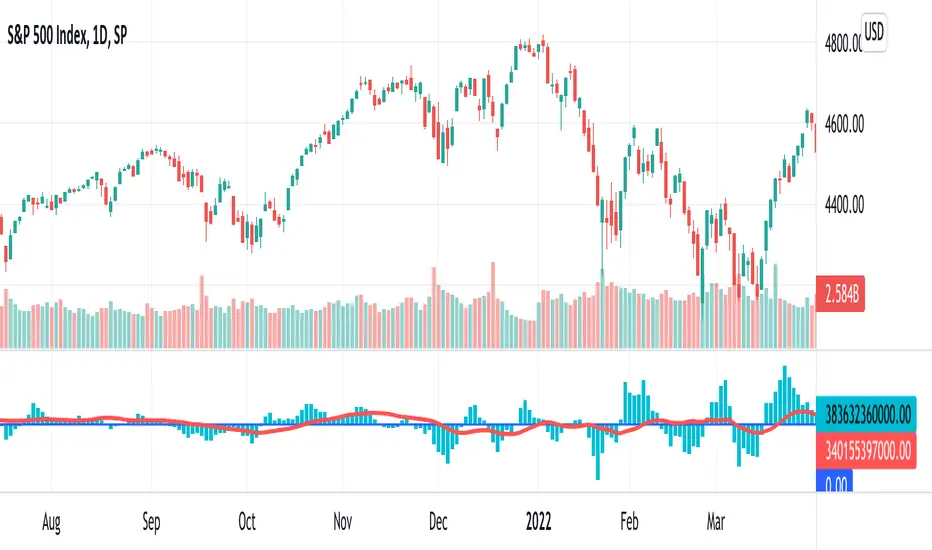
Trading signals can be generated by comparing the ANV with either the SMA or the zero line:
- ANV above SMA: bullish;
- ANV below SMA: bearish;
- ANV above zero: bullish;
- ANV below zero: bearish.
Given that SMA signals are generally triggered earlier than the zero line signals, aggressive traders can trade based on the SMA line, while more conservative traders can trade based on the zero line (i.e., waiting for ANV to turn positive or negative).
Accumulated Net Value (ANV) is an indicator that gauges buying/selling strength by looking at whether the closing price is closer to the high or the low. It’s like a tug of war - if buyers are more dominant, then the closing price should be closer to the high; and if sellers are more dominant, then the closing price should be closer to the low.
Additional adjustments are implemented to address price gaps. The indicator first compares the high and low of the current bar with the previous bar, and then use the higher high/lower low among the current and previous bars to calculate the distance from the closing price.
Price is only part of the equation. We know that volume is also an important factor when considering the strength of buyers and sellers. The ANV indicator takes volume into account by multiplying volume with the difference between the closing price and the high or low (depending on which one is more dominant). This generates the ANV for one bar, where such one-bar ANV will have a positive value during buyer-dominant conditions, and a negative value during seller-dominant conditions.
Since ANV for only one bar can be quite choppy, this indicator further adds the ANV of N bars together to get the final ANV signal, and then applies a simple moving average (SMA) to it.
The Variables:
This indicator has two inputs: (1) N bars of Accumulation, and (2) SMA Length.
N bars of Accumulation determines how many bars of ANV values are added together. SMA Length determines the length of SMA applied to the final ANV.
For daily charts, I use “5” or “10” for N bars of accumulation and “20” for SMA length.
For weekly charts, I use “4” for N bars of accumulation and “10” for SMA length.
The user will have to do some testing to see which numbers suit their needs. Smaller values are more sensitive and move faster, but show more choppiness and false signals. Larger values tend to be more reliable, but are slow to react to price movements.
The Signals:
Trading signals can be generated by comparing the ANV with either the SMA or the zero line:
- ANV above SMA: bullish;
- ANV below SMA: bearish;
- ANV above zero: bullish;
- ANV below zero: bearish.
Given that SMA signals are generally triggered earlier than the zero line signals, aggressive traders can trade based on the SMA line, while more conservative traders can trade based on the zero line (i.e., waiting for ANV to turn positive or negative).
Skrip dilindungi
Skrip ini diterbitkan sebagai sumber tertutup. Akan tetapi, anda boleh menggunakannya secara bebas dan tanpa apa-apa had – ketahui lebih di sini.
Penafian
Maklumat dan penerbitan adalah tidak bertujuan, dan tidak membentuk, nasihat atau cadangan kewangan, pelaburan, dagangan atau jenis lain yang diberikan atau disahkan oleh TradingView. Baca lebih dalam Terma Penggunaan.