OPEN-SOURCE SCRIPT
Telah dikemas kini Histogram Momentum Shaded Candles
Description:
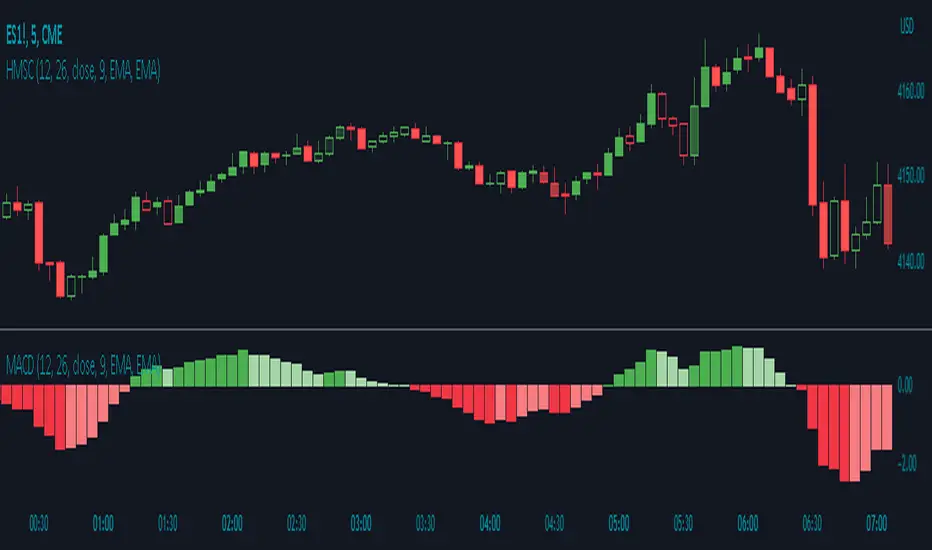
The Histogram Momentum Shaded Candles indicator (HMSC) is a powerful technical analysis tool that combines the concepts of the MACD (Moving Average Convergence Divergence) indicator and shaded candlestick visualization. It provides insights into momentum and trend strength by representing the MACD histogram as shaded candles on the chart.
How it Works:
The HMSC indicator calculates the MACD (Moving Average Convergence Divergence) using user-defined parameters such as the fast length, slow length, source, signal smoothing, and moving average types. It then calculates the MACD histogram by subtracting the signal line from the MACD line. The indicator transforms the histogram values into transparency levels for the shaded candles, representing bullish and bearish momentum.
Usage:
To effectively utilize the Histogram Momentum Shaded Candles indicator, follow these steps:
1. Apply the HMSC indicator to your chart by adding it from the available indicators.
2. Customize the MACD settings such as the fast length, slow length, source, signal smoothing, and moving average types according to your trading preferences.
3. Observe the shaded candles plotted on the chart:
- Bullish shaded candles (green by default) indicate positive momentum and potential buying pressure.
- Bearish shaded candles (red by default) indicate negative momentum and potential selling pressure.
4. Assess the intensity of the shaded candles:
5. Shading intensity is determined by the magnitude of the MACD histogram, with higher values resulting in more opaque candles.
6. The shading intensity reflects the strength of momentum and can help identify significant shifts in price action.
7. Combine the analysis of shaded candles with traditional candlestick patterns, trend lines, support and resistance levels, and other technical indicators to validate potential trade setups.
8. Implement appropriate risk management strategies, including setting stop-loss orders and position sizing, to manage your trades effectively and protect your capital.
Nota Keluaran
The calculations to the shading increments have been updated to be useable and move visible over any time period.Nota Keluaran
Default MACD histogram settings adjusted to the standard 12, 26, 9Nota Keluaran
The MACD indicator, with lines removed, has been added to the Histogram Momentum Shaded Candles chart image to allow users a visual representation of how the indicator functions without it needing to be applied.Skrip sumber terbuka
Dalam semangat sebenar TradingView, pencipta skrip ini telah menjadikannya sumber terbuka supaya pedagang dapat menilai dan mengesahkan kefungsiannya. Terima kasih kepada penulis! Walaupun anda boleh menggunakannya secara percuma, ingat bahawa menerbitkan semula kod ini adalah tertakluk kepada Peraturan Dalaman kami.
Penafian
Maklumat dan penerbitan adalah tidak dimaksudkan untuk menjadi, dan tidak membentuk, nasihat untuk kewangan, pelaburan, perdagangan dan jenis-jenis lain atau cadangan yang dibekalkan atau disahkan oleh TradingView. Baca dengan lebih lanjut di Terma Penggunaan.
Skrip sumber terbuka
Dalam semangat sebenar TradingView, pencipta skrip ini telah menjadikannya sumber terbuka supaya pedagang dapat menilai dan mengesahkan kefungsiannya. Terima kasih kepada penulis! Walaupun anda boleh menggunakannya secara percuma, ingat bahawa menerbitkan semula kod ini adalah tertakluk kepada Peraturan Dalaman kami.
Penafian
Maklumat dan penerbitan adalah tidak dimaksudkan untuk menjadi, dan tidak membentuk, nasihat untuk kewangan, pelaburan, perdagangan dan jenis-jenis lain atau cadangan yang dibekalkan atau disahkan oleh TradingView. Baca dengan lebih lanjut di Terma Penggunaan.