TimeSeriesRecurrencePlot
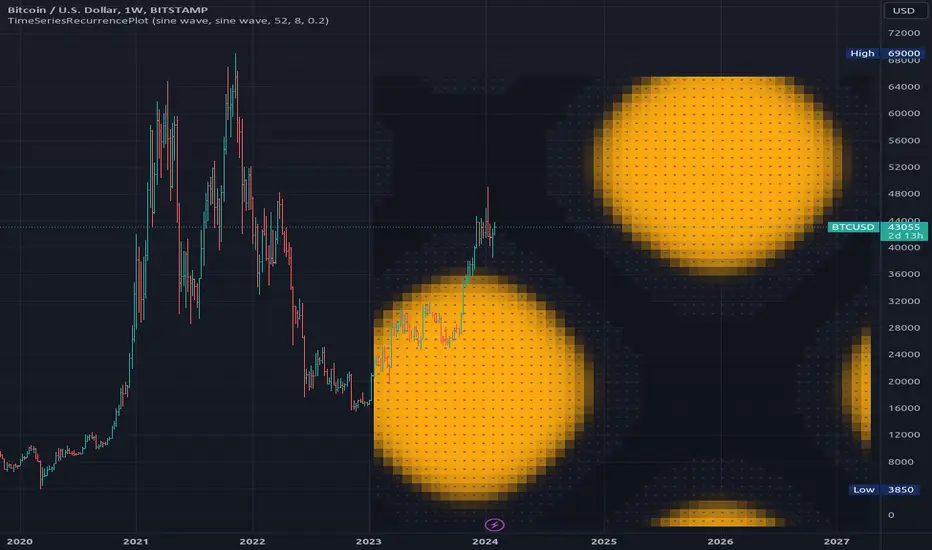
In descriptive statistics and chaos theory, a recurrence plot (RP) is a plot showing, for each moment i i in time, the times at which the state of a dynamical system returns to the previous state at `i`, i.e., when the phase space trajectory visits roughly the same area in the phase space as at time `j`.
```
A recurrence plot (RP) is a graphical representation used in the analysis of time series data and dynamical systems. It visualizes recurring states or events over time by transforming the original time series into a binary matrix, where each element represents whether two consecutive points are above or below a specified threshold. The resulting Recurrence Plot Matrix reveals patterns, structures, and correlations within the data while providing insights into underlying mechanisms of complex systems.
```
~starling7b
___
Reference:
en.wikipedia.org/wiki/Recurrence_plot
github.com/johannfaouzi/pyts/blob/main/pyts/image/recurrence.py
github.com/bmfreis/recurrence_python/blob/master/cross_recurrence.py
github.com/bmfreis/recurrence_cpp/blob/master/CrossRecurrencePlot.cpp
github.com/JuliaDynamics/RecurrenceAnalysis.jl/blob/main/src/matrices/distance_matrix.jl
juliadynamics.github.io/RecurrenceAnalysis.jl/v2.0/rplots/
distance_matrix(series1, series2, max_freq, norm)
Generate distance matrix between two series.
Parameters:
series1 (float): Source series 1.
series2 (float): Source series 2.
max_freq (int): Maximum frequency to inpect or the size of the generated matrix.
norm (string): Norm of the distance metric, default=`euclidean`, options=`euclidean`, `manhattan`, `max`.
Returns: Matrix with distance values.
method normalize_distance(M)
Normalizes a matrix within its Min-Max range.
Namespace types: matrix<float>
Parameters:
M (matrix<float>): Source matrix.
Returns: Normalized matrix.
method threshold(M, threshold)
Updates the matrix with the condition `M(i,j) > threshold ? 1 : 0`.
Namespace types: matrix<float>
Parameters:
M (matrix<float>): Source matrix.
threshold (float)
Returns: Cross matrix.
rolling_window(a, b, sample_size)
An experimental alternative method to plot a recurrence_plot.
Parameters:
a (array<float>): Array with data.
b (array<float>): Array with data.
sample_size (int)
Returns: Recurrence_plot matrix.
Perpustakaan Pine
Dalam semangat sebenar TradingView, penulis telah menerbitkan kod Pine ini sebagai perpustakaan sumber terbuka supaya pengaturcara Pine lain dari komuniti kami boleh menggunakannya semula. Sorakan kepada penulis! Anda juga boleh menggunakan perpustakaan ini secara peribadi atau dalam penerbitan sumber terbuka lain, tetapi penggunaan semula kod ini dalam penerbitan adalah tertakluk kepada Peraturan Dalaman.
Penafian
Perpustakaan Pine
Dalam semangat sebenar TradingView, penulis telah menerbitkan kod Pine ini sebagai perpustakaan sumber terbuka supaya pengaturcara Pine lain dari komuniti kami boleh menggunakannya semula. Sorakan kepada penulis! Anda juga boleh menggunakan perpustakaan ini secara peribadi atau dalam penerbitan sumber terbuka lain, tetapi penggunaan semula kod ini dalam penerbitan adalah tertakluk kepada Peraturan Dalaman.