FastMetrixLibrary "FastMetrix"
This is a library I've been tweaking and working with for a while and I find it useful to get valuable technical analysis metrics faster (why its called FastMetrix). A lot of is personal to my trading style, so sorry if it does not have everything you want. The way I get my variables from library to script is by copying the return function into my new script.
TODO: Volatility and short term price analysis functions
slope(source, smoothing)
Parameters:
source (float)
smoothing (int)
integral(topfunction, bottomfunction, start, end)
Parameters:
topfunction (float)
bottomfunction (float)
start (int)
end (int)
deviation(x, y)
Parameters:
x (float)
y (float)
getema(len)
TODO: return important exponential long term moving averages and derivatives/variables
Parameters:
len (simple int)
getsma(len)
TODO: return requested sma
Parameters:
len (int)
kc(mult, len)
TODO: Return Keltner Channels variables and calculations
Parameters:
mult (simple float)
len (simple int)
bollinger(len, mult)
TODO: returns bollinger bands with optimal settings
Parameters:
len (int)
mult (simple float)
volatility(atrlen, smoothing)
TODO: Returns volatility indicators based on atr
Parameters:
atrlen (simple int)
smoothing (int)
premarketfib()
countinday(xcondition)
Parameters:
xcondition (bool)
countinsession(condition, n)
Parameters:
condition (bool)
n (int)
MATH
MathConstantsSolarSystemLibrary "MathConstantsSolarSystem"
Properties and data for the celestial objects in the Solar System.
LMAsLibrary "LMAs"
Credits
Thank you to @QuantraSystems for dynamic calculations.
Introduction
This lightweight library offers dynamic implementations of popular moving averages that adapt their length automatically as new bars are added to the chart.
Each function is built on a dynamic length formula:
len = math.min(maxLength, bar_index + 1)
This approach ensures that calculations begin as early as the first bar, allowing for smoother initialization and more consistent behavior across all timeframes. It’s especially useful in custom scripts that run from bar 0 or when historical data is limited.
Usage
You can use this library as a drop-in replacement for standard moving averages. It provides more flexibility and stability in live or backtesting environments where fixed-length indicators may delay or fail to initialize properly.
Why Use This?
• Works from the very first bar
• Avoids na values during early bars
• Great for real-time indicators, strategies, and bar-replay
• Clean and efficient code with dynamic behavior
How to Use
Import the library into your script and call any of the included functions just like you would with their native counterparts.
Summary
A lightweight Pine Script™ library offering dynamic moving averages that work seamlessly from the very first bar. Ideal for strategies and indicators requiring robust initialization and adaptive behavior.
SMA(sourceData, maxLength)
Dynamic SMA
Parameters:
sourceData (float)
maxLength (int)
EMA(src, length)
Dynamic EMA
Parameters:
src (float)
length (int)
DEMA(src, length)
Dynamic DEMA
Parameters:
src (float)
length (int)
TEMA(src, length)
Dynamic TEMA
Parameters:
src (float)
length (int)
WMA(src, length)
Dynamic WMA
Parameters:
src (float)
length (int)
HMA(src, length)
Dynamic HMA
Parameters:
src (float)
length (int)
VWMA(src, volsrc, length)
Dynamic VWMA
Parameters:
src (float)
volsrc (float)
length (int)
SMMA(src, length)
Dynamic SMMA
Parameters:
src (float)
length (int)
LSMA(src, length, offset)
Dynamic LSMA
Parameters:
src (float)
length (int)
offset (int)
RMA(src, length)
Dynamic RMA
Parameters:
src (float)
length (int)
ALMA(src, length, offset_sigma, sigma)
Dynamic ALMA
Parameters:
src (float)
length (int)
offset_sigma (float)
sigma (float)
ZLSMA(src, length)
Dynamic ZLSMA
Parameters:
src (float)
length (int)
FRAMA(src, length)
Parameters:
src (float)
length (int)
KAMA(src, length)
Dynamic KAMA
Parameters:
src (float)
length (int)
JMA(src, length, phase)
Dynamic JMA
Parameters:
src (float)
length (int)
phase (float)
T3(src, length, volumeFactor)
Dynamic T3
Parameters:
src (float)
length (int)
volumeFactor (float)

StatMetricsLibrary "StatMetrics"
A utility library for common statistical indicators and ratios used in technical analysis.
Includes Z-Score, correlation, PLF, SRI, Sharpe, Sortino, Omega ratios, and normalization tools.
zscore(src, len)
Calculates the Z-score of a series
Parameters:
src (float) : The input price or series (e.g., close)
len (simple int) : The lookback period for mean and standard deviation
Returns: Z-score: number of standard deviations the input is from the mean
corr(x, y, len)
Computes Pearson correlation coefficient between two series
Parameters:
x (float) : First series
y (float) : Second series
len (simple int) : Lookback period
Returns: Correlation coefficient between -1 and 1
plf(src, longLen, shortLen, smoothLen)
Calculates the Price Lag Factor (PLF) as the difference between long and short Z-scores, normalized and smoothed
Parameters:
src (float) : Source series (e.g., close)
longLen (simple int) : Long Z-score period
shortLen (simple int) : Short Z-score period
smoothLen (simple int) : Hull MA smoothing length
Returns: Smoothed and normalized PLF oscillator
sri(signal, len)
Computes the Statistical Reliability Index (SRI) based on trend persistence
Parameters:
signal (float) : A price or signal series (e.g., smoothed PLF)
len (simple int) : Lookback period for smoothing and deviation
Returns: Normalized trend reliability score
sharpe(src, len)
Calculates the Sharpe Ratio over a period
Parameters:
src (float) : Price series (e.g., close)
len (simple int) : Lookback period
Returns: Sharpe ratio value
sortino(src, len)
Calculates the Sortino Ratio over a period, using only downside volatility
Parameters:
src (float) : Price series
len (simple int) : Lookback period
Returns: Sortino ratio value
omega(src, len)
Calculates the Omega Ratio as the ratio of upside to downside return area
Parameters:
src (float) : Price series
len (simple int) : Lookback period
Returns: Omega ratio value
beta(asset, benchmark, len)
Calculates beta coefficient of asset vs benchmark using rolling covariance
Parameters:
asset (float) : Series of the asset (e.g., close)
benchmark (float) : Series of the benchmark (e.g., SPX close)
len (simple int) : Lookback window
Returns: Beta value (slope of linear regression)
alpha(asset, benchmark, len)
Calculates rolling alpha of an asset relative to a benchmark
Parameters:
asset (float) : Series of the asset (e.g., close)
benchmark (float) : Series of the benchmark (e.g., SPX close)
len (simple int) : Lookback window
Returns: Alpha value (excess return not explained by Beta exposure)
skew(x, len)
Computes skewness of a return series
Parameters:
x (float) : Input series (e.g., returns)
len (simple int) : Lookback period
Returns: Skewness value
kurtosis(x, len)
Computes kurtosis of a return series
Parameters:
x (float) : Input series (e.g., returns)
len (simple int) : Lookback period
Returns: Kurtosis value
cv(x, len)
Calculates Coefficient of Variation
Parameters:
x (float) : Input series (e.g., returns or prices)
len (simple int) : Lookback period
Returns: CV value
autocorr(x, len)
Calculates autocorrelation with 1-lag
Parameters:
x (float) : Series to test
len (simple int) : Lookback window
Returns: Autocorrelation at lag 1
stderr(x, len)
Calculates rolling standard error of a series
Parameters:
x (float) : Input series
len (simple int) : Lookback window
Returns: Standard error (std dev / sqrt(n))
info_ratio(asset, benchmark, len)
Calculates the Information Ratio
Parameters:
asset (float) : Asset price series
benchmark (float) : Benchmark price series
len (simple int) : Lookback period
Returns: Information ratio (alpha / tracking error)
tracking_error(asset, benchmark, len)
Measures deviation from benchmark (Tracking Error)
Parameters:
asset (float) : Asset return series
benchmark (float) : Benchmark return series
len (simple int) : Lookback window
Returns: Tracking error value
max_drawdown(x, len)
Computes maximum drawdown over a rolling window
Parameters:
x (float) : Price series
len (simple int) : Lookback window
Returns: Rolling max drawdown percentage (as a negative value)
zscore_signal(z, ob, os)
Converts Z-score into a 3-level signal
Parameters:
z (float) : Z-score series
ob (float) : Overbought threshold
os (float) : Oversold threshold
Returns: -1, 0, or 1 depending on signal state
r_squared(x, y, len)
Calculates rolling R-squared (coefficient of determination)
Parameters:
x (float) : Asset returns
y (float) : Benchmark returns
len (simple int) : Lookback window
Returns: R-squared value (0 to 1)
entropy(x, len)
Approximates Shannon entropy using log returns
Parameters:
x (float) : Price series
len (simple int) : Lookback period
Returns: Approximate entropy
zreversal(z)
Detects Z-score reversals to the mean
Parameters:
z (float) : Z-score series
Returns: +1 on upward reversal, -1 on downward
momentum_rank(x, len)
Calculates relative momentum strength
Parameters:
x (float) : Price series
len (simple int) : Lookback window
Returns: Proportion of lookback where current price is higher
normalize(x, len)
Normalizes a series to a 0–1 range over a period
Parameters:
x (float) : The input series
len (simple int) : Lookback period
Returns: Normalized value between 0 and 1
composite_score(score1, score2, score3)
Combines multiple normalized scores into a composite score
Parameters:
score1 (float)
score2 (float)
score3 (float)
Returns: Average composite score

FvgCalculations█ OVERVIEW
This library provides the core calculation engine for identifying Fair Value Gaps (FVGs) across different timeframes and for processing their interaction with price. It includes functions to detect FVGs on both the current chart and higher timeframes, as well as to check for their full or partial mitigation.
█ CONCEPTS
The library's primary functions revolve around the concept of Fair Value Gaps and their lifecycle.
Fair Value Gap (FVG) Identification
An FVG, or imbalance, represents a price range where buying or selling pressure was significant enough to cause a rapid price movement, leaving an "inefficiency" in the market. This library identifies FVGs based on three-bar patterns:
Bullish FVG: Forms when the low of the current bar (bar 3) is higher than the high of the bar two periods prior (bar 1). The FVG is the space between the high of bar 1 and the low of bar 3.
Bearish FVG: Forms when the high of the current bar (bar 3) is lower than the low of the bar two periods prior (bar 1). The FVG is the space between the low of bar 1 and the high of bar 3.
The library provides distinct functions for detecting FVGs on the current (Low Timeframe - LTF) and specified higher timeframes (Medium Timeframe - MTF / High Timeframe - HTF).
FVG Mitigation
Mitigation refers to price revisiting an FVG.
Full Mitigation: An FVG is considered fully mitigated when price completely closes the gap. For a bullish FVG, this occurs if the current low price moves below or touches the FVG's bottom. For a bearish FVG, it occurs if the current high price moves above or touches the FVG's top.
Partial Mitigation (Entry/Fill): An FVG is partially mitigated when price enters the FVG's range but does not fully close it. The library tracks the extent of this fill. For a bullish FVG, if the current low price enters the FVG from above, that low becomes the new effective top of the remaining FVG. For a bearish FVG, if the current high price enters the FVG from below, that high becomes the new effective bottom of the remaining FVG.
FVG Interaction
This refers to any instance where the current bar's price range (high to low) touches or crosses into the currently unfilled portion of an active (visible and not fully mitigated) FVG.
Multi-Timeframe Data Acquisition
To detect FVGs on higher timeframes, specific historical bar data (high, low, and time of bars at indices and relative to the higher timeframe's last completed bar) is required. The requestMultiTFBarData function is designed to fetch this data efficiently.
█ CALCULATIONS AND USE
The functions in this library are typically used in a sequence to manage FVGs:
1. Data Retrieval (for MTF/HTF FVGs):
Call requestMultiTFBarData() with the desired higher timeframe string (e.g., "60", "D").
This returns a tuple of htfHigh1, htfLow1, htfTime1, htfHigh3, htfLow3, htfTime3.
2. FVG Detection:
For LTF FVGs: Call detectFvg() on each confirmed bar. It uses high , low, low , and high along with barstate.isconfirmed.
For MTF/HTF FVGs: Call detectMultiTFFvg() using the data obtained from requestMultiTFBarData().
Both detection functions return an fvgObject (defined in FvgTypes) if an FVG is found, otherwise na. They also can classify FVGs as "Large Volume" (LV) if classifyLV is true and the FVG size (top - bottom) relative to the tfAtr (Average True Range of the respective timeframe) meets the lvAtrMultiplier.
3. FVG State Updates (on each new bar for existing FVGs):
First, check for overall price interaction using fvgInteractionCheck(). This function determines if the current bar's high/low has touched or entered the FVG's currentTop or currentBottom.
If interaction occurs and the FVG is not already mitigated:
Call checkMitigation() to determine if the FVG has been fully mitigated by the current bar's currentHigh and currentLow. If true, the FVG's isMitigated status is updated.
If not fully mitigated, call checkPartialMitigation() to see if the price has further entered the FVG. This function returns the newLevel to which the FVG has been filled (e.g., currentLow for a bullish FVG, currentHigh for bearish). This newLevel is then used to update the FVG's currentTop or currentBottom.
The calling script (e.g., fvgMain.c) is responsible for storing and managing the array of fvgObject instances and passing them to these update functions.
█ NOTES
Bar State for LTF Detection: The detectFvg() function relies on barstate.isconfirmed to ensure FVG detection is based on closed bars, preventing FVGs from being detected prematurely on the currently forming bar.
Higher Timeframe Data (lookahead): The requestMultiTFBarData() function uses lookahead = barmerge.lookahead_on. This means it can access historical data from the higher timeframe that corresponds to the current bar on the chart, even if the higher timeframe bar has not officially closed. This is standard for multi-timeframe analysis aiming to plot historical HTF data accurately on a lower timeframe chart.
Parameter Typing: Functions like detectMultiTFFvg and detectFvg infer the type for boolean (classifyLV) and numeric (lvAtrMultiplier) parameters passed from the main script, while explicitly typed series parameters (like htfHigh1, currentAtr) expect series data.
fvgObject Dependency: The FVG detection functions return fvgObject instances, and fvgInteractionCheck takes an fvgObject as a parameter. This UDT is defined in the FvgTypes library, making it a dependency for using FvgCalculations.
ATR for LV Classification: The tfAtr (for MTF/HTF) and currentAtr (for LTF) parameters are expected to be the Average True Range values for the respective timeframes. These are used, if classifyLV is enabled, to determine if an FVG's size qualifies it as a "Large Volume" FVG based on the lvAtrMultiplier.
MTF/HTF FVG Appearance Timing: When displaying FVGs from a higher timeframe (MTF/HTF) on a lower timeframe (LTF) chart, users might observe that the most recent MTF/HTF FVG appears one LTF bar later compared to its appearance on a native MTF/HTF chart. This is an expected behavior due to the detection mechanism in `detectMultiTFFvg`. This function uses historical bar data from the MTF/HTF (specifically, data equivalent to `HTF_bar ` and `HTF_bar `) to identify an FVG. Therefore, all three bars forming the FVG on the MTF/HTF must be fully closed and have shifted into these historical index positions relative to the `request.security` call from the LTF chart before the FVG can be detected and displayed on the LTF. This ensures that the MTF/HTF FVG is identified based on confirmed, closed bars from the higher timeframe.
█ EXPORTED FUNCTIONS
requestMultiTFBarData(timeframe)
Requests historical bar data for specific previous bars from a specified higher timeframe.
It fetches H , L , T (for the bar before last) and H , L , T (for the bar three periods prior)
from the requested timeframe.
This is typically used to identify FVG patterns on MTF/HTF.
Parameters:
timeframe (simple string) : The higher timeframe to request data from (e.g., "60" for 1-hour, "D" for Daily).
Returns: A tuple containing: .
- htfHigh1 (series float): High of the bar at index 1 (one bar before the last completed bar on timeframe).
- htfLow1 (series float): Low of the bar at index 1.
- htfTime1 (series int) : Time of the bar at index 1.
- htfHigh3 (series float): High of the bar at index 3 (three bars before the last completed bar on timeframe).
- htfLow3 (series float): Low of the bar at index 3.
- htfTime3 (series int) : Time of the bar at index 3.
detectMultiTFFvg(htfHigh1, htfLow1, htfTime1, htfHigh3, htfLow3, htfTime3, tfAtr, classifyLV, lvAtrMultiplier, tfType)
Detects a Fair Value Gap (FVG) on a higher timeframe (MTF/HTF) using pre-fetched bar data.
Parameters:
htfHigh1 (float) : High of the first relevant bar (typically high ) from the higher timeframe.
htfLow1 (float) : Low of the first relevant bar (typically low ) from the higher timeframe.
htfTime1 (int) : Time of the first relevant bar (typically time ) from the higher timeframe.
htfHigh3 (float) : High of the third relevant bar (typically high ) from the higher timeframe.
htfLow3 (float) : Low of the third relevant bar (typically low ) from the higher timeframe.
htfTime3 (int) : Time of the third relevant bar (typically time ) from the higher timeframe.
tfAtr (float) : ATR value for the higher timeframe, used for Large Volume (LV) FVG classification.
classifyLV (bool) : If true, FVGs will be assessed to see if they qualify as Large Volume.
lvAtrMultiplier (float) : The ATR multiplier used to define if an FVG is Large Volume.
tfType (series tfType enum from no1x/FvgTypes/1) : The timeframe type (e.g., types.tfType.MTF, types.tfType.HTF) of the FVG being detected.
Returns: An fvgObject instance if an FVG is detected, otherwise na.
detectFvg(classifyLV, lvAtrMultiplier, currentAtr)
Detects a Fair Value Gap (FVG) on the current (LTF - Low Timeframe) chart.
Parameters:
classifyLV (bool) : If true, FVGs will be assessed to see if they qualify as Large Volume.
lvAtrMultiplier (float) : The ATR multiplier used to define if an FVG is Large Volume.
currentAtr (float) : ATR value for the current timeframe, used for LV FVG classification.
Returns: An fvgObject instance if an FVG is detected, otherwise na.
checkMitigation(isBullish, fvgTop, fvgBottom, currentHigh, currentLow)
Checks if an FVG has been fully mitigated by the current bar's price action.
Parameters:
isBullish (bool) : True if the FVG being checked is bullish, false if bearish.
fvgTop (float) : The top price level of the FVG.
fvgBottom (float) : The bottom price level of the FVG.
currentHigh (float) : The high price of the current bar.
currentLow (float) : The low price of the current bar.
Returns: True if the FVG is considered fully mitigated, false otherwise.
checkPartialMitigation(isBullish, currentBoxTop, currentBoxBottom, currentHigh, currentLow)
Checks for partial mitigation of an FVG by the current bar's price action.
It determines if the price has entered the FVG and returns the new fill level.
Parameters:
isBullish (bool) : True if the FVG being checked is bullish, false if bearish.
currentBoxTop (float) : The current top of the FVG box (this might have been adjusted by previous partial fills).
currentBoxBottom (float) : The current bottom of the FVG box (similarly, might be adjusted).
currentHigh (float) : The high price of the current bar.
currentLow (float) : The low price of the current bar.
Returns: The new price level to which the FVG has been filled (e.g., currentLow for a bullish FVG).
Returns na if no new partial fill occurred on this bar.
fvgInteractionCheck(fvg, highVal, lowVal)
Checks if the current bar's price interacts with the given FVG.
Interaction means the price touches or crosses into the FVG's
current (possibly partially filled) range.
Parameters:
fvg (fvgObject type from no1x/FvgTypes/1) : The FVG object to check.
Its isMitigated, isVisible, isBullish, currentTop, and currentBottom fields are used.
highVal (float) : The high price of the current bar.
lowVal (float) : The low price of the current bar.
Returns: True if price interacts with the FVG, false otherwise.

WeightedVolumeUtilsLibrary "WeightedVolumeUtils"
fun(x)
Returns the input value (placeholder function).
Parameters:
x (float) : A float value.
Returns: The same float value passed as input.
weightedBSEVolume()
Calculates the weighted volume for BSE index based on top constituent stocks.
Returns: Weighted volume value based on fixed weights for BSE SENSEX stocks.
getAdjustedVolume()
Returns the adjusted volume for SENSEX or regular volume otherwise.
Returns: Weighted BSE volume if current symbol is SENSEX, else raw volume.
MathSpecialFunctionsConvolve1DLibrary "MathSpecialFunctionsConvolve1D"
Convolution is one of the most important mathematical operations used in signal processing. This simple mathematical operation pops up in many scientific and industrial applications, from its use in a billion-layer large CNN to simple image denoising.
___
Reference:
www.algorithm-archive.org
numpy.org
lloydrochester.com
www.geeksforgeeks.org
f(signal, filter)
Convolve
Parameters:
signal (array) : List with signal data.
filter (array) : List with weights to apply to the signal data.
Returns: Discrete, linear convolution of `signal` and `filter`.

ErrorFunctionsLibrary "ErrorFunctions"
A collection of functions used to approximate the area beneath a Gaussian curve.
Because an ERF (Error Function) is an integral, there is no closed-form solution to calculating the area beneath the curve. Meaning all ERFs are approximations; precisely wrong, but mostly accurate. How close you need to get to the actual area depends entirely on your use case, with more precision being less efficient.
The internal precision of floats in Pine Script is 1e-16 (16 decimals, aka. double precision). This library adapts well known algorithms designed to efficiently reach double precision. Single precision alternates are also included. All of them were made free to use, modify, and distribute by their original authors.
HASTINGS
Adaptation of a single precision ERF by Cecil Hastings Jr, published through Princeton University in 1955. It was later documented by Abramowitz and Stegun as equation 7.1.26 in their 1972 Handbook of Mathematical Functions. Fast, efficient, and ideal when precision beyond a few decimals is unnecessary.
GILES
Adaptation of a single precision Inverse ERF by Michael Giles, published through the University of Oxford in 2012. It reverses the ERF, estimating an X coordinate from an area. It too is fast, efficient, and ideal when precision beyond a few decimals is unnecessary.
LIBC
Adaptation of the double precision ERF & ERFC in the standard C library (aka. libc). It is also the same ERF & ERFC that SciPy uses. While not quite as efficient as the Hastings approximation, it's still very fast and fully maximizes Pines precision.
BOOST
Adaptation of the double precision Inverse ERF & Inverse ERFC in the Boost Math C++ library. SciPy uses these as well. These reverse the ERF & ERFC, estimating an X coordinate from an area. It too isn't quite as efficient as the Giles approximation, but still fast and fully maximizes Pines precision.
While these algorithms are not exported directly, they are available through their exported counterparts.
- - -
ERROR FUNCTIONS
erf(x, precise)
An Error Function estimates the theoretical error of a measurement.
Parameters:
x (float) : (float) Upper limit of the integration.
precise (bool) : Double precision (true) or single precision (false).
Returns: (float) Between -1 and 1.
erfc(x, precise)
A Complementary Error Function estimates the difference between a theoretical error and infinity.
Parameters:
x (float) : (float) Lower limit of the integration.
precise (bool) : Double precision (true) or single precision (false).
Returns: (float) Between 0 and 2.
erfinv(x, precise)
An Inverse Error Function reverses the erf() by estimating the original measurement from the theoretical error.
Parameters:
x (float) : (float) Theoretical error.
precise (bool) : Double precision (true) or single precision (false).
Returns: (float) Between 0 and ± infinity.
erfcinv(x, precise)
An Inverse Complementary Error Function reverses the erfc() by estimating the original measurement from the difference between the theoretical error and infinity.
Parameters:
x (float) : (float) Difference between the theoretical error and infinity.
precise (bool) : Double precision (true) or single precision (false).
Returns: (float) Between 0 and ± infinity.
- - -
DISTRIBUTION FUNCTIONS
pdf(x, m, s)
A Probability Density Function estimates the probability density . For clarity, density is not a probability .
Parameters:
x (float) : (float) X coordinate for which a density will be estimated.
m (float) : (float) Mean
s (float) : (float) Sigma
Returns: (float) Between 0 and ∞.
cdf(z, precise)
A Cumulative Distribution Function estimates the area under a Gaussian curve between negative infinity and the Z Score.
Parameters:
z (float) : (float) Z Score.
precise (bool) : Double precision (true) or single precision (false).
Returns: (float) Between 0 and 1.
cdfinv(a, precise)
An Inverse Cumulative Distribution Function reverses the cdf() by estimating the Z Score from an area.
Parameters:
a (float) : (float) Area between 0 and 1.
precise (bool) : Double precision (true) or single precision (false).
Returns: (float) Between -∞ and +∞
cdfab(z1, z2, precise)
A Cumulative Distribution Function from A to B estimates the area under a Gaussian curve between two Z Scores (A and B).
Parameters:
z1 (float) : (float) First Z Score.
z2 (float) : (float) Second Z Score.
precise (bool) : Double precision (true) or single precision (false).
Returns: (float) Between 0 and 1.
ttt(z, precise)
A Two-Tailed Test estimates the area under a Gaussian curve between symmetrical ± Z scores and ± infinity.
Parameters:
z (float) : (float) One of the symmetrical Z Scores.
precise (bool) : Double precision (true) or single precision (false).
Returns: (float) Between 0 and 1.
tttinv(a, precise)
An Inverse Two-Tailed Test reverses the ttt() by estimating the absolute Z Score from an area.
Parameters:
a (float) : (float) Area between 0 and 1.
precise (bool) : Double precision (true) or single precision (false).
Returns: (float) Between 0 and ∞.
ott(z, precise)
A One-Tailed Test estimates the area under a Gaussian curve between an absolute Z Score and infinity.
Parameters:
z (float) : (float) Z Score.
precise (bool) : Double precision (true) or single precision (false).
Returns: (float) Between 0 and 1.
ottinv(a, precise)
An Inverse One-Tailed Test Reverses the ott() by estimating the Z Score from a an area.
Parameters:
a (float) : (float) Area between 0 and 1.
precise (bool) : Double precision (true) or single precision (false).
Returns: (float) Between 0 and ∞.

pymath█ OVERVIEW
This library ➕ enhances Pine Script's built-in types (`float`, `int`, `array`, `array`) with mathematical methods, mirroring 🪞 many functions from Python's `math` module. Import this library to overload or add to built-in capabilities, enabling calls like `myFloat.sin()` or `myIntArray.gcd()`.
█ CONCEPTS
This library wraps Pine's built-in `math.*` functions and implements others where necessary, expanding the mathematical toolkit available within Pine Script. It provides a more object-oriented approach to mathematical operations on core data types.
█ HOW TO USE
• Import the library: i mport kaigouthro/pymath/1
• Call methods directly on variables: myFloat.sin() , myIntArray.gcd()
• For raw integer literals, you MUST use parentheses: `(1234).factorial()`.
█ FEATURES
• **Infinity Handling:** Includes `isinf()` and `isfinite()` for robust checks. Uses `POS_INF_PROXY` to represent infinity.
• **Comprehensive Math Functions:** Implements a wide range of methods, including trigonometric, logarithmic, hyperbolic, and array operations.
• **Object-Oriented Approach:** Allows direct method calls on `int`, `float`, and arrays for cleaner code.
• **Improved Accuracy:** Some functions (e.g., `remainder()`) offer improved accuracy compared to default Pine behavior.
• **Helper Functions:** Internal helper functions optimize calculations and handle edge cases.
█ NOTES
This library improves upon Pine Script's built-in `math` functions by adding new ones and refining existing implementations. It handles edge cases such as infinity, NaN, and zero values, enhancing the reliability of your Pine scripts. For Speed, it wraps and uses built-ins, as thy are fastest.
█ EXAMPLES
//@version=6
indicator("My Indicator")
// Import the library
import kaigouthro/pymath/1
// Create some Vars
float myFloat = 3.14159
int myInt = 10
array myIntArray = array.from(1, 2, 3, 4, 5)
// Now you can...
plot( myFloat.sin() ) // Use sin() method on a float, using built in wrapper
plot( (myInt).factorial() ) // Factorial of an integer (note parentheses)
plot( myIntArray.gcd() ) // GCD of an integer array
method isinf(self)
isinf: Checks if this float is positive or negative infinity using a proxy value.
Namespace types: series float, simple float, input float, const float
Parameters:
self (float) : (float) value to check.
Returns: (bool) `true` if the absolute value of `self` is greater than or equal to the infinity proxy, `false` otherwise.
method isfinite(self)
isfinite: Checks if this float is finite (not NaN and not infinity).
Namespace types: series float, simple float, input float, const float
Parameters:
self (float) : (float) The value to check.
Returns: (bool) `true` if `self` is not `na` and not infinity (as defined by `isinf()`), `false` otherwise.
method fmod(self, divisor)
fmod: Returns the C-library style floating-point remainder of `self / divisor` (result has the sign of `self`).
Namespace types: series float, simple float, input float, const float
Parameters:
self (float) : (float) Dividend `x`.
divisor (float) : (float) Divisor `y`. Cannot be zero or `na`.
Returns: (float) The remainder `x - n*y` where n is `trunc(x/y)`, or `na` if divisor is 0, `na`, or inputs are infinite in a way that prevents calculation.
method factorial(self)
factorial: Calculates the factorial of this non-negative integer.
Namespace types: series int, simple int, input int, const int
Parameters:
self (int) : (int) The integer `n`. Must be non-negative.
Returns: (float) `n!` as a float, or `na` if `n` is negative or overflow occurs (based on `isinf`).
method isqrt(self)
isqrt: Calculates the integer square root of this non-negative integer (floor of the exact square root).
Namespace types: series int, simple int, input int, const int
Parameters:
self (int) : (int) The non-negative integer `n`.
Returns: (int) The greatest integer `a` such that a² <= n, or `na` if `n` is negative.
method comb(self, k)
comb: Calculates the number of ways to choose `k` items from `self` items without repetition and without order (Binomial Coefficient).
Namespace types: series int, simple int, input int, const int
Parameters:
self (int) : (int) Total number of items `n`. Must be non-negative.
k (int) : (int) Number of items to choose. Must be non-negative.
Returns: (float) The binomial coefficient nCk, or `na` if inputs are invalid (n<0 or k<0), `k > n`, or overflow occurs.
method perm(self, k)
perm: Calculates the number of ways to choose `k` items from `self` items without repetition and with order (Permutations).
Namespace types: series int, simple int, input int, const int
Parameters:
self (int) : (int) Total number of items `n`. Must be non-negative.
k (simple int) : (simple int = na) Number of items to choose. Must be non-negative. Defaults to `n` if `na`.
Returns: (float) The number of permutations nPk, or `na` if inputs are invalid (n<0 or k<0), `k > n`, or overflow occurs.
method log2(self)
log2: Returns the base-2 logarithm of this float. Input must be positive. Wraps `math.log(self) / math.log(2.0)`.
Namespace types: series float, simple float, input float, const float
Parameters:
self (float) : (float) The input number. Must be positive.
Returns: (float) The base-2 logarithm, or `na` if input <= 0.
method trunc(self)
trunc: Returns this float with the fractional part removed (truncates towards zero).
Namespace types: series float, simple float, input float, const float
Parameters:
self (float) : (float) The input number.
Returns: (int) The integer part, or `na` if input is `na` or infinite.
method abs(self)
abs: Returns the absolute value of this float. Wraps `math.abs()`.
Namespace types: series float, simple float, input float, const float
Parameters:
self (float) : (float) The input number.
Returns: (float) The absolute value, or `na` if input is `na`.
method acos(self)
acos: Returns the arccosine of this float, in radians. Wraps `math.acos()`. Input must be between -1 and 1.
Namespace types: series float, simple float, input float, const float
Parameters:
self (float) : (float) The input number. Must be between -1 and 1.
Returns: (float) Angle in radians , or `na` if input is outside or `na`.
method asin(self)
asin: Returns the arcsine of this float, in radians. Wraps `math.asin()`. Input must be between -1 and 1.
Namespace types: series float, simple float, input float, const float
Parameters:
self (float) : (float) The input number. Must be between -1 and 1.
Returns: (float) Angle in radians , or `na` if input is outside or `na`.
method atan(self)
atan: Returns the arctangent of this float, in radians. Wraps `math.atan()`.
Namespace types: series float, simple float, input float, const float
Parameters:
self (float) : (float) The input number.
Returns: (float) Angle in radians , or `na` if input is `na`.
method ceil(self)
ceil: Returns the ceiling of this float (smallest integer >= self). Wraps `math.ceil()`.
Namespace types: series float, simple float, input float, const float
Parameters:
self (float) : (float) The input number.
Returns: (int) The ceiling value, or `na` if input is `na` or infinite.
method cos(self)
cos: Returns the cosine of this float (angle in radians). Wraps `math.cos()`.
Namespace types: series float, simple float, input float, const float
Parameters:
self (float) : (float) The angle in radians.
Returns: (float) The cosine, or `na` if input is `na`.
method degrees(self)
degrees: Converts this float from radians to degrees. Wraps `math.todegrees()`.
Namespace types: series float, simple float, input float, const float
Parameters:
self (float) : (float) The angle in radians.
Returns: (float) The angle in degrees, or `na` if input is `na`.
method exp(self)
exp: Returns e raised to the power of this float. Wraps `math.exp()`.
Namespace types: series float, simple float, input float, const float
Parameters:
self (float) : (float) The exponent.
Returns: (float) `e**self`, or `na` if input is `na`.
method floor(self)
floor: Returns the floor of this float (largest integer <= self). Wraps `math.floor()`.
Namespace types: series float, simple float, input float, const float
Parameters:
self (float) : (float) The input number.
Returns: (int) The floor value, or `na` if input is `na` or infinite.
method log(self)
log: Returns the natural logarithm (base e) of this float. Wraps `math.log()`. Input must be positive.
Namespace types: series float, simple float, input float, const float
Parameters:
self (float) : (float) The input number. Must be positive.
Returns: (float) The natural logarithm, or `na` if input <= 0 or `na`.
method log10(self)
log10: Returns the base-10 logarithm of this float. Wraps `math.log10()`. Input must be positive.
Namespace types: series float, simple float, input float, const float
Parameters:
self (float) : (float) The input number. Must be positive.
Returns: (float) The base-10 logarithm, or `na` if input <= 0 or `na`.
method pow(self, exponent)
pow: Returns this float raised to the power of `exponent`. Wraps `math.pow()`.
Namespace types: series float, simple float, input float, const float
Parameters:
self (float) : (float) The base.
exponent (float) : (float) The exponent.
Returns: (float) `self**exponent`, or `na` if inputs are `na` or lead to undefined results.
method radians(self)
radians: Converts this float from degrees to radians. Wraps `math.toradians()`.
Namespace types: series float, simple float, input float, const float
Parameters:
self (float) : (float) The angle in degrees.
Returns: (float) The angle in radians, or `na` if input is `na`.
method round(self)
round: Returns the nearest integer to this float. Wraps `math.round()`. Ties are rounded away from zero.
Namespace types: series float, simple float, input float, const float
Parameters:
self (float) : (float) The input number.
Returns: (int) The rounded integer, or `na` if input is `na` or infinite.
method sign(self)
sign: Returns the sign of this float (-1, 0, or 1). Wraps `math.sign()`.
Namespace types: series float, simple float, input float, const float
Parameters:
self (float) : (float) The input number.
Returns: (int) -1 if negative, 0 if zero, 1 if positive, `na` if input is `na`.
method sin(self)
sin: Returns the sine of this float (angle in radians). Wraps `math.sin()`.
Namespace types: series float, simple float, input float, const float
Parameters:
self (float) : (float) The angle in radians.
Returns: (float) The sine, or `na` if input is `na`.
method sqrt(self)
sqrt: Returns the square root of this float. Wraps `math.sqrt()`. Input must be non-negative.
Namespace types: series float, simple float, input float, const float
Parameters:
self (float) : (float) The input number. Must be non-negative.
Returns: (float) The square root, or `na` if input < 0 or `na`.
method tan(self)
tan: Returns the tangent of this float (angle in radians). Wraps `math.tan()`.
Namespace types: series float, simple float, input float, const float
Parameters:
self (float) : (float) The angle in radians.
Returns: (float) The tangent, or `na` if input is `na`.
method acosh(self)
acosh: Returns the inverse hyperbolic cosine of this float. Input must be >= 1.
Namespace types: series float, simple float, input float, const float
Parameters:
self (float) : (float) The input number. Must be >= 1.
Returns: (float) The inverse hyperbolic cosine, or `na` if input < 1 or `na`.
method asinh(self)
asinh: Returns the inverse hyperbolic sine of this float.
Namespace types: series float, simple float, input float, const float
Parameters:
self (float) : (float) The input number.
Returns: (float) The inverse hyperbolic sine, or `na` if input is `na`.
method atanh(self)
atanh: Returns the inverse hyperbolic tangent of this float. Input must be between -1 and 1 (exclusive).
Namespace types: series float, simple float, input float, const float
Parameters:
self (float) : (float) The input number. Must be between -1 and 1 (exclusive).
Returns: (float) The inverse hyperbolic tangent, or `na` if input is outside (-1, 1) or `na`.
method cosh(self)
cosh: Returns the hyperbolic cosine of this float.
Namespace types: series float, simple float, input float, const float
Parameters:
self (float) : (float) The input number.
Returns: (float) The hyperbolic cosine, or `na` if input is `na`.
method sinh(self)
sinh: Returns the hyperbolic sine of this float.
Namespace types: series float, simple float, input float, const float
Parameters:
self (float) : (float) The input number.
Returns: (float) The hyperbolic sine, or `na` if input is `na`.
method tanh(self)
tanh: Returns the hyperbolic tangent of this float.
Namespace types: series float, simple float, input float, const float
Parameters:
self (float) : (float) The input number.
Returns: (float) The hyperbolic tangent, or `na` if input is `na`.
method atan2(self, dx)
atan2: Returns the angle in radians between the positive x-axis and the point (dx, self). Wraps `math.atan2()`.
Namespace types: series float, simple float, input float, const float
Parameters:
self (float) : (float) The y-coordinate `y`.
dx (float) : (float) The x-coordinate `x`.
Returns: (float) The angle in radians , result of `math.atan2(self, dx)`. Returns `na` if inputs are `na`. Note: `math.atan2(0, 0)` returns 0 in Pine.
Optimization: Use built-in math.atan2()
method cbrt(self)
cbrt: Returns the cube root of this float.
Namespace types: series float, simple float, input float, const float
Parameters:
self (float) : (float) The value to find the cube root of.
Returns: (float) The real cube root. Handles negative inputs correctly, or `na` if input is `na`.
method exp2(self)
exp2: Returns 2 raised to the power of this float. Calculated as `2.0.pow(self)`.
Namespace types: series float, simple float, input float, const float
Parameters:
self (float) : (float) The exponent.
Returns: (float) `2**self`, or `na` if input is `na` or results in non-finite value.
method expm1(self)
expm1: Returns `e**self - 1`. Calculated as `self.exp() - 1.0`. May offer better precision for small `self` in some environments, but Pine provides no guarantee over `self.exp() - 1.0`.
Namespace types: series float, simple float, input float, const float
Parameters:
self (float) : (float) The exponent.
Returns: (float) `e**self - 1`, or `na` if input is `na` or `self.exp()` is `na`.
method log1p(self)
log1p: Returns the natural logarithm of (1 + self). Calculated as `(1.0 + self).log()`. Pine provides no specific precision guarantee for self near zero.
Namespace types: series float, simple float, input float, const float
Parameters:
self (float) : (float) Value to add to 1. `1 + self` must be positive.
Returns: (float) Natural log of `1 + self`, or `na` if input is `na` or `1 + self <= 0`.
method modf(self)
modf: Returns the fractional and integer parts of this float as a tuple ` `. Both parts have the sign of `self`.
Namespace types: series float, simple float, input float, const float
Parameters:
self (float) : (float) The number `x` to split.
Returns: ( ) A tuple containing ` `, or ` ` if `x` is `na` or non-finite.
method remainder(self, divisor)
remainder: Returns the IEEE 754 style remainder of `self` with respect to `divisor`. Result `r` satisfies `abs(r) <= 0.5 * abs(divisor)`. Uses round-half-to-even.
Namespace types: series float, simple float, input float, const float
Parameters:
self (float) : (float) Dividend `x`.
divisor (float) : (float) Divisor `y`. Cannot be zero or `na`.
Returns: (float) The IEEE 754 remainder, or `na` if divisor is 0, `na`, or inputs are non-finite in a way that prevents calculation.
method copysign(self, signSource)
copysign: Returns a float with the magnitude (absolute value) of `self` but the sign of `signSource`.
Namespace types: series float, simple float, input float, const float
Parameters:
self (float) : (float) Value providing the magnitude `x`.
signSource (float) : (float) Value providing the sign `y`.
Returns: (float) `abs(x)` with the sign of `y`, or `na` if either input is `na`.
method frexp(self)
frexp: Returns the mantissa (m) and exponent (e) of this float `x` as ` `, such that `x = m * 2^e` and `0.5 <= abs(m) < 1` (unless `x` is 0).
Namespace types: series float, simple float, input float, const float
Parameters:
self (float) : (float) The number `x` to decompose.
Returns: ( ) A tuple ` `, or ` ` if `x` is 0, or ` ` if `x` is non-finite or `na`.
method isclose(self, other, rel_tol, abs_tol)
isclose: Checks if this float `a` and `other` float `b` are close within relative and absolute tolerances.
Namespace types: series float, simple float, input float, const float
Parameters:
self (float) : (float) First value `a`.
other (float) : (float) Second value `b`.
rel_tol (simple float) : (simple float = 1e-9) Relative tolerance. Must be non-negative and less than 1.0.
abs_tol (simple float) : (simple float = 0.0) Absolute tolerance. Must be non-negative.
Returns: (bool) `true` if `abs(a - b) <= max(rel_tol * max(abs(a), abs(b)), abs_tol)`. Handles `na`/`inf` appropriately. Returns `na` if tolerances are invalid.
method ldexp(self, exponent)
ldexp: Returns `self * (2**exponent)`. Inverse of `frexp`.
Namespace types: series float, simple float, input float, const float
Parameters:
self (float) : (float) Mantissa part `x`.
exponent (int) : (int) Exponent part `i`.
Returns: (float) The result of `x * pow(2, i)`, or `na` if inputs are `na` or result is non-finite.
method gcd(self)
gcd: Calculates the Greatest Common Divisor (GCD) of all integers in this array.
Namespace types: array
Parameters:
self (array) : (array) An array of integers.
Returns: (int) The largest positive integer that divides all non-zero elements, 0 if all elements are 0 or array is empty. Returns `na` if any element is `na`.
method lcm(self)
lcm: Calculates the Least Common Multiple (LCM) of all integers in this array.
Namespace types: array
Parameters:
self (array) : (array) An array of integers.
Returns: (int) The smallest positive integer that is a multiple of all non-zero elements, 0 if any element is 0, 1 if array is empty. Returns `na` on potential overflow or if any element is `na`.
method dist(self, other)
dist: Returns the Euclidean distance between this point `p` and another point `q` (given as arrays of coordinates).
Namespace types: array
Parameters:
self (array) : (array) Coordinates of the first point `p`.
other (array) : (array) Coordinates of the second point `q`. Must have the same size as `p`.
Returns: (float) The Euclidean distance, or `na` if arrays have different sizes, are empty, or contain `na`/non-finite values.
method fsum(self)
fsum: Returns an accurate floating-point sum of values in this array. Uses built-in `array.sum()`. Note: Pine Script does not guarantee the same level of precision tracking as Python's `math.fsum`.
Namespace types: array
Parameters:
self (array) : (array) The array of floats to sum.
Returns: (float) The sum of the array elements. Returns 0.0 for an empty array. Returns `na` if any element is `na`.
method hypot(self)
hypot: Returns the Euclidean norm (distance from origin) for this point given by coordinates in the array. `sqrt(sum(x*x for x in coordinates))`.
Namespace types: array
Parameters:
self (array) : (array) Array of coordinates defining the point.
Returns: (float) The Euclidean norm, or 0.0 if the array is empty. Returns `na` if any element is `na` or non-finite.
method prod(self, start)
prod: Calculates the product of all elements in this array.
Namespace types: array
Parameters:
self (array) : (array) The array of values to multiply.
start (simple float) : (simple float = 1.0) The starting value for the product (returned if the array is empty).
Returns: (float) The product of array elements * start. Returns `na` if any element is `na`.
method sumprod(self, other)
sumprod: Returns the sum of products of values from this array `p` and another array `q` (dot product).
Namespace types: array
Parameters:
self (array) : (array) First array of values `p`.
other (array) : (array) Second array of values `q`. Must have the same size as `p`.
Returns: (float) The sum of `p * q ` for all i, or `na` if arrays have different sizes or contain `na`/non-finite values. Returns 0.0 for empty arrays.

SMCFunctionsLibrary "SMCFunctions"
findSwingPoints(high, low, swing_size)
Parameters:
high (float)
low (float)
swing_size (int)
detectBOS(close, high, low, prevHigh, prevLow, highActive, lowActive, bos_conf_type)
Parameters:
close (float)
high (float)
low (float)
prevHigh (float)
prevLow (float)
highActive (bool)
lowActive (bool)
bos_conf_type (string)
getBOSDetails(highBroken, lowBroken, prevHigh, prevLow, prevSwing, prevHighIndex, prevLowIndex, input_show_choch)
Parameters:
highBroken (bool)
lowBroken (bool)
prevHigh (float)
prevLow (float)
prevSwing (int)
prevHighIndex (int)
prevLowIndex (int)
input_show_choch (bool)
calculateRetracementLevels(start_price, end_price)
Parameters:
start_price (float)
end_price (float)

MLExtensions_CoreLibrary "MLExtensions_Core"
A set of extension methods for a novel implementation of a Approximate Nearest Neighbors (ANN) algorithm in Lorentzian space, focused on computation.
normalizeDeriv(src, quadraticMeanLength)
Returns the smoothed hyperbolic tangent of the input series.
Parameters:
src (float) : The input series (i.e., the first-order derivative for price).
quadraticMeanLength (int) : The length of the quadratic mean (RMS).
Returns: nDeriv The normalized derivative of the input series.
normalize(src, min, max)
Rescales a source value with an unbounded range to a target range.
Parameters:
src (float) : The input series
min (float) : The minimum value of the unbounded range
max (float) : The maximum value of the unbounded range
Returns: The normalized series
rescale(src, oldMin, oldMax, newMin, newMax)
Rescales a source value with a bounded range to anther bounded range
Parameters:
src (float) : The input series
oldMin (float) : The minimum value of the range to rescale from
oldMax (float) : The maximum value of the range to rescale from
newMin (float) : The minimum value of the range to rescale to
newMax (float) : The maximum value of the range to rescale to
Returns: The rescaled series
getColorShades(color)
Creates an array of colors with varying shades of the input color
Parameters:
color (color) : The color to create shades of
Returns: An array of colors with varying shades of the input color
getPredictionColor(prediction, neighborsCount, shadesArr)
Determines the color shade based on prediction percentile
Parameters:
prediction (float) : Value of the prediction
neighborsCount (int) : The number of neighbors used in a nearest neighbors classification
shadesArr (array) : An array of colors with varying shades of the input color
Returns: shade Color shade based on prediction percentile
color_green(prediction)
Assigns varying shades of the color green based on the KNN classification
Parameters:
prediction (float) : Value (int|float) of the prediction
Returns: color
color_red(prediction)
Assigns varying shades of the color red based on the KNN classification
Parameters:
prediction (float) : Value of the prediction
Returns: color
tanh(src)
Returns the the hyperbolic tangent of the input series. The sigmoid-like hyperbolic tangent function is used to compress the input to a value between -1 and 1.
Parameters:
src (float) : The input series (i.e., the normalized derivative).
Returns: tanh The hyperbolic tangent of the input series.
dualPoleFilter(src, lookback)
Returns the smoothed hyperbolic tangent of the input series.
Parameters:
src (float) : The input series (i.e., the hyperbolic tangent).
lookback (int) : The lookback window for the smoothing.
Returns: filter The smoothed hyperbolic tangent of the input series.
tanhTransform(src, smoothingFrequency, quadraticMeanLength)
Returns the tanh transform of the input series.
Parameters:
src (float) : The input series (i.e., the result of the tanh calculation).
smoothingFrequency (int)
quadraticMeanLength (int)
Returns: signal The smoothed hyperbolic tangent transform of the input series.
n_rsi(src, n1, n2)
Returns the normalized RSI ideal for use in ML algorithms.
Parameters:
src (float) : The input series (i.e., the result of the RSI calculation).
n1 (simple int) : The length of the RSI.
n2 (simple int) : The smoothing length of the RSI.
Returns: signal The normalized RSI.
n_cci(src, n1, n2)
Returns the normalized CCI ideal for use in ML algorithms.
Parameters:
src (float) : The input series (i.e., the result of the CCI calculation).
n1 (simple int) : The length of the CCI.
n2 (simple int) : The smoothing length of the CCI.
Returns: signal The normalized CCI.
n_wt(src, n1, n2)
Returns the normalized WaveTrend Classic series ideal for use in ML algorithms.
Parameters:
src (float) : The input series (i.e., the result of the WaveTrend Classic calculation).
n1 (simple int)
n2 (simple int)
Returns: signal The normalized WaveTrend Classic series.
n_adx(highSrc, lowSrc, closeSrc, n1)
Returns the normalized ADX ideal for use in ML algorithms.
Parameters:
highSrc (float) : The input series for the high price.
lowSrc (float) : The input series for the low price.
closeSrc (float) : The input series for the close price.
n1 (simple int) : The length of the ADX.
regime_filter(src, threshold, useRegimeFilter)
Parameters:
src (float)
threshold (float)
useRegimeFilter (bool)
filter_adx(src, length, adxThreshold, useAdxFilter)
filter_adx
Parameters:
src (float) : The source series.
length (simple int) : The length of the ADX.
adxThreshold (int) : The ADX threshold.
useAdxFilter (bool) : Whether to use the ADX filter.
Returns: The ADX.
filter_volatility(minLength, maxLength, sensitivityMultiplier, useVolatilityFilter)
filter_volatility
Parameters:
minLength (simple int) : The minimum length of the ATR.
maxLength (simple int) : The maximum length of the ATR.
sensitivityMultiplier (float) : Multiplier for the historical ATR to control sensitivity.
useVolatilityFilter (bool) : Whether to use the volatility filter.
Returns: Boolean indicating whether or not to let the signal pass through the filter.

TUF_LOGICTUF_LOGIC: Three-Value Logic for Pine Script v6
The TUF_LOGIC library implements a robust three-valued logic system (trilean logic) for Pine Script v6, providing a formal framework for reasoning about uncertain or incomplete information in financial markets. By extending beyond binary True/False states to include an explicit "Uncertain" state, this library enables more nuanced algorithmic decision-making, particularly valuable in environments characterized by imperfect information.
Core Architecture
TUF_LOGIC offers two complementary interfaces for working with trilean values:
Enum-Based API (Recommended): Leverages Pine Script v6's enum capabilities with Trilean.True , Trilean.Uncertain , and Trilean.False for improved type safety and performance.
Integer-Based API (Legacy Support): Maintains compatibility with existing code using integer values 1 (True), 0 (Uncertain), and -1 (False).
Fundamental Operations
The library provides type conversion methods for seamless interaction between integer representation and enum types ( to_trilean() , to_int() ), along with validation functions to maintain trilean invariants.
Logical Operators
TUF_LOGIC extends traditional boolean operators to the trilean domain with NOT , AND , OR , XOR , and EQUALITY functions that properly handle the Uncertain state according to the principles of three-valued logic.
The library implements three different implication operators providing flexibility for different logical requirements: IMP_K (Kleene's approach), IMP_L (Łukasiewicz's approach), and IMP_RM3 (Relevant implication under RM3 logic).
Inspired by Tarski-Łukasiewicz's modal logic formulations, TUF_LOGIC includes modal operators: MA (Modal Assertion) evaluates whether a state is possibly true; LA (Logical Assertion) determines if a state is necessarily true; and IA (Indeterminacy Assertion) identifies explicitly uncertain states.
The UNANIMOUS operator evaluates trilean values for complete agreement, returning the consensus value if one exists or Uncertain otherwise. This function is available for both pairs of values and arrays of trilean values.
Practical Applications
TUF_LOGIC excels in financial market scenarios where decision-making must account for uncertainty. It enables technical indicator consensus by combining signals with different confidence levels, supports multi-timeframe analysis by reconciling potentially contradictory signals, enhances risk management by explicitly modeling uncertainty, and handles partial information systems where some data sources may be unreliable.
By providing a mathematically sound framework for reasoning about uncertainty, TUF_LOGIC elevates trading system design beyond simplistic binary logic, allowing for more sophisticated decision-making that better reflects real-world market complexity.
Library "TUF_LOGIC"
Three-Value Logic (TUF: True, Uncertain, False) implementation for Pine Script.
This library provides a comprehensive set of logical operations supporting trilean logic systems,
including Kleene, Łukasiewicz, and RM3 implications. Compatible with Pine v6 enums.
method validate(self)
Ensures a valid trilean integer value by clamping to the appropriate range .
Namespace types: series int, simple int, input int, const int
Parameters:
self (int) : The integer value to validate.
Returns: An integer value guaranteed to be within the valid trilean range.
method to_trilean(self)
Converts an integer value to a Trilean enum value.
Namespace types: series int, simple int, input int, const int
Parameters:
self (int) : The integer to convert (typically -1, 0, or 1).
Returns: A Trilean enum value: True (1), Uncertain (0), or False (-1).
method to_int(self)
Converts a Trilean enum value to its corresponding integer representation.
Namespace types: series Trilean
Parameters:
self (series Trilean) : The Trilean enum value to convert.
Returns: Integer value: 1 (True), 0 (Uncertain), or -1 (False).
method NOT(self)
Negates a trilean integer value (NOT operation).
Namespace types: series int, simple int, input int, const int
Parameters:
self (int) : The integer value to negate.
Returns: Negated integer value: 1 -> -1, 0 -> 0, -1 -> 1.
method NOT(self)
Negates a Trilean enum value (NOT operation).
Namespace types: series Trilean
Parameters:
self (series Trilean) : The Trilean enum value to negate.
Returns: Negated Trilean: True -> False, Uncertain -> Uncertain, False -> True.
method AND(self, comparator)
Logical AND operation for trilean integer values.
Namespace types: series int, simple int, input int, const int
Parameters:
self (int) : The first integer value.
comparator (int) : The second integer value to compare with.
Returns: Integer result of the AND operation (minimum value).
method AND(self, comparator)
Logical AND operation for Trilean enum values following three-valued logic.
Namespace types: series Trilean
Parameters:
self (series Trilean) : The first Trilean enum value.
comparator (series Trilean) : The second Trilean enum value to compare with.
Returns: Trilean result of the AND operation.
method OR(self, comparator)
Logical OR operation for trilean integer values.
Namespace types: series int, simple int, input int, const int
Parameters:
self (int) : The first integer value.
comparator (int) : The second integer value to compare with.
Returns: Integer result of the OR operation (maximum value).
method OR(self, comparator)
Logical OR operation for Trilean enum values following three-valued logic.
Namespace types: series Trilean
Parameters:
self (series Trilean) : The first Trilean enum value.
comparator (series Trilean) : The second Trilean enum value to compare with.
Returns: Trilean result of the OR operation.
method EQUALITY(self, comparator)
Logical EQUALITY operation for trilean integer values.
Namespace types: series int, simple int, input int, const int
Parameters:
self (int) : The first integer value.
comparator (int) : The second integer value to compare with.
Returns: Integer representation (1/-1) indicating if values are equal.
method EQUALITY(self, comparator)
Logical EQUALITY operation for Trilean enum values.
Namespace types: series Trilean
Parameters:
self (series Trilean) : The first Trilean enum value.
comparator (series Trilean) : The second Trilean enum value to compare with.
Returns: Trilean.True if both values are equal, Trilean.False otherwise.
method XOR(self, comparator)
Logical XOR (Exclusive OR) operation for trilean integer values.
Namespace types: series int, simple int, input int, const int
Parameters:
self (int) : The first integer value.
comparator (int) : The second integer value to compare with.
Returns: Integer result of the XOR operation.
method XOR(self, comparator)
Logical XOR (Exclusive OR) operation for Trilean enum values.
Namespace types: series Trilean
Parameters:
self (series Trilean) : The first Trilean enum value.
comparator (series Trilean) : The second Trilean enum value to compare with.
Returns: Trilean result of the XOR operation.
method IMP_K(self, comparator)
Material implication using Kleene's logic for trilean integer values.
Namespace types: series int, simple int, input int, const int
Parameters:
self (int) : The antecedent integer value.
comparator (int) : The consequent integer value.
Returns: Integer result of Kleene's implication operation.
method IMP_K(self, comparator)
Material implication using Kleene's logic for Trilean enum values.
Namespace types: series Trilean
Parameters:
self (series Trilean) : The antecedent Trilean enum value.
comparator (series Trilean) : The consequent Trilean enum value.
Returns: Trilean result of Kleene's implication operation.
method IMP_L(self, comparator)
Logical implication using Łukasiewicz's logic for trilean integer values.
Namespace types: series int, simple int, input int, const int
Parameters:
self (int) : The antecedent integer value.
comparator (int) : The consequent integer value.
Returns: Integer result of Łukasiewicz's implication operation.
method IMP_L(self, comparator)
Logical implication using Łukasiewicz's logic for Trilean enum values.
Namespace types: series Trilean
Parameters:
self (series Trilean) : The antecedent Trilean enum value.
comparator (series Trilean) : The consequent Trilean enum value.
Returns: Trilean result of Łukasiewicz's implication operation.
method IMP_RM3(self, comparator)
Logical implication using RM3 logic for trilean integer values.
Namespace types: series int, simple int, input int, const int
Parameters:
self (int) : The antecedent integer value.
comparator (int) : The consequent integer value.
Returns: Integer result of the RM3 implication operation.
method IMP_RM3(self, comparator)
Logical implication using RM3 logic for Trilean enum values.
Namespace types: series Trilean
Parameters:
self (series Trilean) : The antecedent Trilean enum value.
comparator (series Trilean) : The consequent Trilean enum value.
Returns: Trilean result of the RM3 implication operation.
method MA(self)
Modal Assertion (MA) operation for trilean integer values.
Namespace types: series int, simple int, input int, const int
Parameters:
self (int) : The integer value to evaluate.
Returns: 1 if the value is 1 or 0, -1 if the value is -1.
method MA(self)
Modal Assertion (MA) operation for Trilean enum values.
Namespace types: series Trilean
Parameters:
self (series Trilean) : The Trilean enum value to evaluate.
Returns: Trilean.True if value is True or Uncertain, Trilean.False if value is False.
method LA(self)
Logical Assertion (LA) operation for trilean integer values.
Namespace types: series int, simple int, input int, const int
Parameters:
self (int) : The integer value to evaluate.
Returns: 1 if the value is 1, -1 otherwise.
method LA(self)
Logical Assertion (LA) operation for Trilean enum values.
Namespace types: series Trilean
Parameters:
self (series Trilean) : The Trilean enum value to evaluate.
Returns: Trilean.True if value is True, Trilean.False otherwise.
method IA(self)
Indeterminacy Assertion (IA) operation for trilean integer values.
Namespace types: series int, simple int, input int, const int
Parameters:
self (int) : The integer value to evaluate.
Returns: 1 if the value is 0, -1 otherwise.
method IA(self)
Indeterminacy Assertion (IA) operation for Trilean enum values.
Namespace types: series Trilean
Parameters:
self (series Trilean) : The Trilean enum value to evaluate.
Returns: Trilean.True if value is Uncertain, Trilean.False otherwise.
method UNANIMOUS(self, comparator)
Evaluates the unanimity between two trilean integer values.
Namespace types: series int, simple int, input int, const int
Parameters:
self (int) : The first integer value.
comparator (int) : The second integer value.
Returns: Integer value of self if both values are equal, 0 (Uncertain) otherwise.
method UNANIMOUS(self, comparator)
Evaluates the unanimity between two Trilean enum values.
Namespace types: series Trilean
Parameters:
self (series Trilean) : The first Trilean enum value.
comparator (series Trilean) : The second Trilean enum value.
Returns: Value of self if both values are equal, Trilean.Uncertain otherwise.
method UNANIMOUS(self)
Evaluates the unanimity among an array of trilean integer values.
Namespace types: array
Parameters:
self (array) : The array of integer values.
Returns: First value if all values are identical, 0 (Uncertain) otherwise.
method UNANIMOUS(self)
Evaluates the unanimity among an array of Trilean enum values.
Namespace types: array
Parameters:
self (array) : The array of Trilean enum values.
Returns: First value if all values are identical, Trilean.Uncertain otherwise.
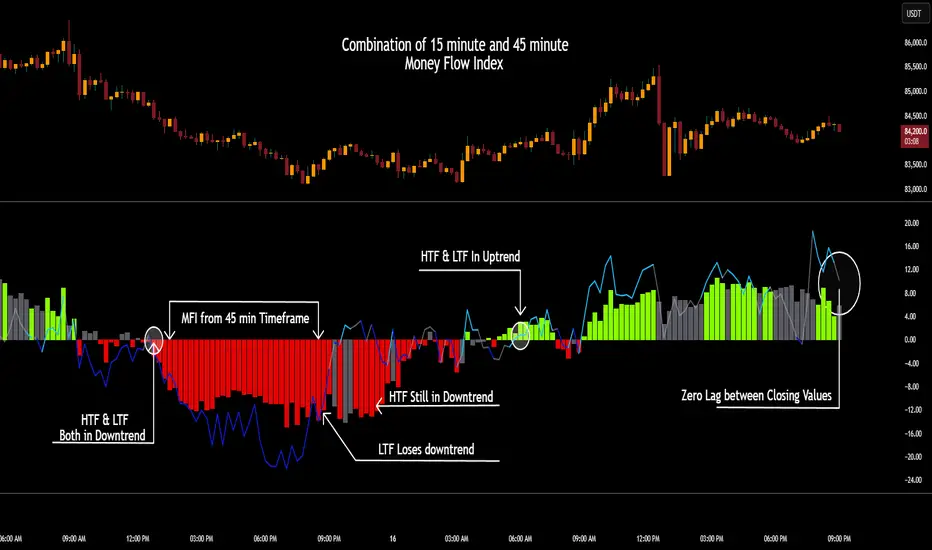
CSCMultiTimeframeToolsLibrary "CSCMultiTimeframeTools"
Calculates instant higher timeframe values for higher timeframe analysis with zero lag.
getAdjustedLookback(current_tf_minutes, higher_tf_minutes, length)
Calculate adjusted lookback period for higher timeframe conversion.
Parameters:
current_tf_minutes (int) : Current chart timeframe in minutes (e.g., 5 for 5m).
higher_tf_minutes (int) : Target higher timeframe in minutes (e.g., 15 for 15m).
length (int) : Base length value (e.g., 14 for RSI/MFI).
Returns: Adjusted lookback period (length × multiplier).
Purpose and Benefits of the TimeframeTools Library
This library is designed to solve a critical pain point for traders who rely on higher timeframe (HTF) indicator values while analyzing lower timeframe (LTF) charts. Traditional methods require waiting for multiple candles to close—for example, to see a 1-hour RSI on a 5-minute chart, you’d need 12 closed candles (5m × 12 = 60m) before the value updates. This lag means missed opportunities, delayed signals, and inefficient decision-making.
Why Traders Need This
Whether you’re scalping (5M/15M) or swing trading (1H/4H), this library bridges the gap between timeframes, giving you HTF context in real time—so you can act faster, with confidence.
How This Library Eliminates the Waiting Game
By dynamically calculating the adjusted lookback period, the library allows:
Real-time HTF values on LTF charts – No waiting for candle closes.
Accurate conversions – A 14-period RSI on a 1-hour chart translates to 168 periods (14 × 12) on a 5-minute chart, ensuring mathematical precision.
Flexible application – Works with common indicators like RSI, MFI, CCI, and moving averages (though confirmations should be done before publishing under your own secondary use).
Key Advantages Over Manual Methods
Speed: Instantly reflects HTF values without waiting for candle resolutions.
Adaptability: Adjusts automatically if the user changes timeframes or lengths.
Consistency: Removes human error in manual period calculations.
Limitations to Note
Not a magic bullet – While it solves the lag issue, traders should still:
Validate signals with price action or additional confirmations.
Be mindful of extreme lookback lengths (e.g., a 200-period daily SMA on a 1-minute chart requires 28,800 periods, which may strain performance).
FunctionSurvivalEstimationLibrary "FunctionSurvivalEstimation"
The Survival Estimation function, also known as Kaplan-Meier estimation or product-limit method, is a statistical technique used to estimate the survival probability of an individual over time. It's commonly used in medical research and epidemiology to analyze the survival rates of patients with different treatments, diseases, or risk factors.
What does it do?
The Survival Estimation function takes into account censored observations (i.e., individuals who are still alive at a certain point) and calculates the probability that an individual will survive beyond a specific time period. It's particularly useful when dealing with right-censoring, where some subjects are lost to follow-up or have not experienced the event of interest by the end of the study.
Interpretation
The Survival Estimation function provides a plot of the estimated survival probability over time, which can be used to:
1. Compare survival rates between different groups (e.g., treatment arms)
2. Identify patterns in the data that may indicate differences in mortality or disease progression
3. Make predictions about future outcomes based on historical data
4. In a trading context it may be used to ascertain the survival ratios of trading under specific conditions.
Reference:
www.global-developments.org
"Beyond GDP" ~ www.aeaweb.org
en.wikipedia.org
www.kdnuggets.com
survival_probability(alive_at_age, initial_alive)
Kaplan-Meier Survival Estimator.
Parameters:
alive_at_age (int) : The number of subjects still alive at a age.
initial_alive (int) : The Total number of initial subjects.
Returns: The probability that a subject lives longer than a certain age.
utility(c, l)
Captures the utility value from consumption and leisure.
Parameters:
c (float) : Consumption.
l (float) : Leisure.
Returns: Utility value from consumption and leisure.
welfare_utility(age, b, u, s)
Calculate the welfare utility value based age, basic needs and social interaction.
Parameters:
age (int) : Age of the subject.
b (float) : Value representing basic needs (food, shelter..).
u (float) : Value representing overall well-being and happiness.
s (float) : Value representing social interaction and connection with others.
Returns: Welfare utility value.
expected_lifetime_welfare(beta, consumption, leisure, alive_data, expectation)
Calculates the expected lifetime welfare of an individual based on their consumption, leisure, and survival probability over time.
Parameters:
beta (float) : Discount factor.
consumption (array) : List of consumption values at each step of the subjects life.
leisure (array) : List of leisure values at each step of the subjects life.
alive_data (array) : List of subjects alive at each age, the first element is the total or initial number of subjects.
expectation (float) : Optional, `defaut=1.0`. Expectation or weight given to this calculation.
Returns: Expected lifetime welfare value.

PineVersatilitiesBundleLibrary "PineVersatilitiesBundle"
Versatilities (aka, Versatile Utilities) Pack includes:
- Eighteen Price Variants bundled in a Map,
- Nine Smoothing Variants bundled in a Map,
- Visualisations that indicate on both - pane and chart.
price_variants(lb)
Computes Several different averages using current and previous OHLC values
Parameters:
lb (int) : - lookback distance for combining OHLC values from the past with the present
Returns: Map of Eighteen Uncommon Combinations of single and two-bar OHLC averages (rounded-to-mintick)
dynamic_MA(masrc, malen, lsmaoff, almasgm, almaoff, almaflr)
Dynamically computes Eight different MAs and returns a Map containing Nine MAs
Parameters:
masrc (float) : source series to compute MA
malen (simple int) : lookback distance for MA
lsmaoff (simple int) : optional LSMA offset - default is 0
almasgm (simple float) : optional ALMA sigma - default is 5
almaoff (simple float) : optional ALMA offset - default is 0.5
almaflr (simple bool) : optional ALMA floor flag - default is false
Returns: Map of MAs - 'ALMA', 'EMA', 'HMA', 'LSMA', 'RMA', 'SMA', 'SWMA', 'WMA', 'ALL' (rounded-to-mintick)

NR_VersatilitiesLibrary "NR_Versatilities"
Versatilities (aka, Versatile Utilities) includes:
- Seventeen Price Variants returned as a tuple,
- Eight Smoothing functions rolled into one,
- Pick any Past Value from any series with offset,
- Or just the previous value from any series.
pastVal(src, len)
Fetches past value from src that came len distance ago
Parameters:
src (float) : source series
len (int) : lookback distance - (optional) default is 1
Returns: latest src if len <= 0, else src
previous(src)
Fetches past value from src that came len distance ago
Parameters:
src (float) : source series
Returns: previous value in the series if found, else current value
price_variants()
Computes Several different averages using current and previous OHLC values
Returns: Seventeen Uncommon Average Price Combinations
dynamic_MA(matyp, masrc, malen, lsmaoff, almasgm, almaoff, almaflr)
Dynamically computes Eight different MAs on-demand individually, or an average of all taken together
Parameters:
matyp (string) : pick one of these MAs - ALMA, EMA, HMA, LSMA, RMA, SMA, SWMA, WMA, ALL
masrc (float) : source series to compute MA
malen (simple int) : lookback distance for MA
lsmaoff (simple int) : optional LSMA offset - default is 0
almasgm (simple float) : optional ALMA sigma - default is 5
almaoff (simple float) : optional ALMA offset - default is 0.5
almaflr (simple bool) : optional ALMA floor flag - default is false
Returns: MA series for chosen type or, an average of all of them, if chosen so

TimeframeUtilsCustomLibrary "TimeframeUtilsCustom"
Timeframe utilities library
f_timeframe_to_minutes(tf)
Converts timeframe string to minutes
Parameters:
tf (string) : String representation of timeframe
Returns: Number of minutes in the given timeframe
f_bars_for_hours(timeframe_minutes, hours)
Calculate number of bars for a specified time period
Parameters:
timeframe_minutes (int) : Current timeframe in minutes
hours (int) : Number of hours to calculate bars for
Returns: Number of bars representing the specified hours
f_bars_for_days(timeframe_minutes, days)
Calculate number of bars for a specified number of days
Parameters:
timeframe_minutes (int) : Current timeframe in minutes
days (int) : Number of days to calculate bars for
Returns: Number of bars representing the specified days

rate_of_changeLibrary "rate_of_change"
// @description: Applies ROC algorithm to any pair of values.
// This library function is used to scale change of value (price, volume) to a percentage value, just as the ROC indicator would do. It is good practice to scale arbitrary ranges to set boundaries when you try to train statistical model.
rateOfChange(value, base, hardlimit)
This function is a helper to scale a value change to its percentage value.
Parameters:
value (float)
base (float)
hardlimit (int)
Returns: per: A float comprised between 0 and 100

merge_pinbar_babyblueLibrary "merge_pinbar_babyblue"
merge_pinbar: merge bars and check whether the bar is a pinbar
merge_pinbar_babyblue(period, max_bars)
merge_pinbar: merge bars and check whether the bar is a pinbar
Parameters:
period (simple int)
max_bars (simple int)
Returns: array:
DynamicMALibrary "DynamicMA"
Dynamic Moving Averages Library
Introduction
The Dynamic Moving Averages Library is a specialized collection of custom built functions designed to calculate moving averages dynamically, beginning from the first available bar. Unlike standard moving averages, which rely on fixed length lookbacks, this library ensures that indicators remain fully functional from the very first data point, making it an essential tool for analysing assets with short time series or limited historical data.
This approach allows traders and developers to build robust indicators that do not require a preset amount of historical data before generating meaningful outputs. It is particularly advantageous for:
Newly listed assets with minimal price history.
High-timeframe trading, where large lookback periods can lead to delayed or missing data.
By eliminating the constraints of fixed lookback periods, this library enables the seamless construction of trend indicators, smoothing functions, and hybrid models that adapt instantly to market conditions.
Comprehensive Set of Custom Moving Averages
The library includes a wide range of custom dynamic moving averages, each designed for specific analytical use cases:
SMA (Simple Moving Average) – The fundamental moving average, dynamically computed.
EMA (Exponential Moving Average) – Adaptive smoothing for better trend tracking.
DEMA (Double Exponential Moving Average) – Faster trend detection with reduced lag.
TEMA (Triple Exponential Moving Average) – Even more responsive than DEMA.
WMA (Weighted Moving Average) – Emphasizes recent price action while reducing noise.
VWMA (Volume Weighted Moving Average) – Accounts for volume to give more weight to high-volume periods.
HMA (Hull Moving Average) – A superior smoothing method with low lag.
SMMA (Smoothed Moving Average) – A hybrid approach between SMA and EMA.
LSMA (Least Squares Moving Average) – Uses linear regression for trend detection.
RMA (Relative Moving Average) – Used in RSI-based calculations for smooth momentum readings.
ALMA (Arnaud Legoux Moving Average) – A Gaussian-weighted MA for superior signal clarity.
Hyperbolic MA (HyperMA) – A mathematically optimized averaging method with dynamic weighting.
Each function dynamically adjusts its calculation length to match the available bar count, ensuring instant functionality on all assets.
Fully Optimized for Pine Script v6
This library is built on Pine Script v6, ensuring compatibility with modern TradingView indicators and scripts. It includes exportable functions for seamless integration into custom indicators, making it easy to develop trend-following models, volatility filters, and adaptive risk-management systems.
Why Use Dynamic Moving Averages?
Traditional moving averages suffer from a common limitation: they require a fixed historical window to generate meaningful values. This poses several problems:
New Assets Have No Historical Data - If an asset has only been trading for a short period, traditional moving averages may not be able to generate valid signals.
High Timeframes Require Massive Lookbacks - On 1W or 1M charts, a 200-period SMA would require 200 weeks or months of data, making it unusable on newer assets.
Delayed Signal Initialization - Standard indicators often take dozens of bars to stabilize, reducing effectiveness when trading new trends.
The Dynamic Moving Averages Library eliminates these issues by ensuring that every function:
Starts calculation from bar one, using available data instead of waiting for a lookback period.
Adapts dynamically across timeframes, making it equally effective on low or high timeframes.
Allows smoother, more responsive trend tracking, particularly useful for volatile or low-liquidity assets.
This flexibility makes it indispensable for custom script developers, quantitative analysts, and discretionary traders looking to build more adaptive and resilient indicators.
Final Summary
The Dynamic Moving Averages Library is a versatile and powerful set of functions designed to overcome the limitations of fixed-lookback indicators. By dynamically adjusting the calculation length from the first bar, this library ensures that moving averages remain fully functional across all timeframes and asset types, making it an essential tool for traders and developers alike.
With built-in adaptability, low-lag smoothing, and support for multiple moving average types, this library unlocks new possibilities for quantitative trading and strategy development - especially for assets with short price histories or those traded on higher timeframes.
For traders looking to enhance signal reliability, minimize lag, and build adaptable trading systems, the Dynamic Moving Averages Library provides an efficient and flexible solution.
SMA(sourceData, maxLength)
Dynamic SMA
Parameters:
sourceData (float)
maxLength (int)
EMA(src, length)
Dynamic EMA
Parameters:
src (float)
length (int)
DEMA(src, length)
Dynamic DEMA
Parameters:
src (float)
length (int)
TEMA(src, length)
Dynamic TEMA
Parameters:
src (float)
length (int)
WMA(src, length)
Dynamic WMA
Parameters:
src (float)
length (int)
HMA(src, length)
Dynamic HMA
Parameters:
src (float)
length (int)
VWMA(src, volsrc, length)
Dynamic VWMA
Parameters:
src (float)
volsrc (float)
length (int)
SMMA(src, length)
Dynamic SMMA
Parameters:
src (float)
length (int)
LSMA(src, length, offset)
Dynamic LSMA
Parameters:
src (float)
length (int)
offset (int)
RMA(src, length)
Dynamic RMA
Parameters:
src (float)
length (int)
ALMA(src, length, offset_sigma, sigma)
Dynamic ALMA
Parameters:
src (float)
length (int)
offset_sigma (float)
sigma (float)
HyperMA(src, length)
Dynamic HyperbolicMA
Parameters:
src (float)
length (int)

PaddingThe Padding library is a comprehensive and flexible toolkit designed to extend time series data within TradingView, making it an indispensable resource for advanced signal processing tasks such as FFT, filtering, convolution, and wavelet analysis. At its core, the library addresses the common challenge of edge effects by "padding" your data—that is, by appending additional data points beyond the natural boundaries of your original dataset. This extension not only mitigates the distortions that can occur at the endpoints but also helps to maintain the integrity of various transformations and calculations performed on the series. The library accomplishes this while preserving the ordering of your data, ensuring that the most recent point always resides at index 0.
Central to the functionality of this library are two key enumerations: Direction and PaddingType. The Direction enum determines where the padding will be applied. You can choose to extend the data in the forward direction (ahead of the current values), in the backward direction (behind the current values), or in both directions simultaneously. The PaddingType enum defines the specific method used for extending the data. The library supports several methods—including symmetric, reflect, periodic, antisymmetric, antireflect, smooth, constant, and zero padding—each of which has been implemented to suit different analytical scenarios. For instance, symmetric padding mirrors the original data across its boundaries, while reflect padding continues the trend by reflecting around endpoint values. Periodic padding repeats the data, and antisymmetric padding mirrors the data with alternating signs to counterbalance it. The antireflect and smooth methods take into account the derivatives of your data, thereby extending the series in a way that preserves or smoothly continues these derivative values. Constant and zero padding simply extend the series using fixed endpoint values or zeros. Together, these enums allow you to fine-tune how your data is extended, ensuring that the padding method aligns with the specific requirements of your analysis.
The library is designed to work with both single variable inputs and array inputs. When using array-based methods—particularly with the antireflect and smooth padding types—please note that the implementation intentionally discards the last data point as a result of the delta computation process. This behavior is an important consideration when integrating the library into your TradingView studies, as it affects the overall data length of the padded series. Despite this, the library’s structure and documentation make it straightforward to incorporate into your existing scripts. You simply provide your data source, define the length of your data window, and select the desired padding type and direction, along with any optional parameters to control the extent of the padding (using both_period, forward_period, or backward_period).
In practical application, the Padding library enables you to extend historical data beyond its original range in a controlled and predictable manner. This is particularly useful when preparing datasets for further signal processing, as it helps to reduce artifacts that can otherwise compromise the results of your analytical routines. Whether you are an experienced Pine Script developer or a trader exploring advanced data analysis techniques, this library offers a robust solution that enhances the reliability and accuracy of your studies by ensuring your algorithms operate on a more complete and well-prepared dataset.
Library "Padding"
A comprehensive library for padding time series data with various methods. Supports both single variable and array inputs, with flexible padding directions and periods. Designed for signal processing applications including FFT, filtering, convolution, and wavelets. All methods maintain data ordering with most recent point at index 0.
symmetric(source, series_length, direction, both_period, forward_period, backward_period)
Applies symmetric padding by mirroring the input data across boundaries
Parameters:
source (float) : Input value to pad from
series_length (int) : Length of the data window
direction (series Direction) : Direction to apply padding
both_period (int) : Optional - periods to pad in both directions. Overrides forward_period and backward_period if specified
forward_period (int) : Optional - periods to pad forward. Defaults to series_length if not specified
backward_period (int) : Optional - periods to pad backward. Defaults to series_length if not specified
Returns: Array ordered with most recent point at index 0, containing original data with symmetric padding applied
method symmetric(source, direction, both_period, forward_period, backward_period)
Applies symmetric padding to an array by mirroring the data across boundaries
Namespace types: array
Parameters:
source (array) : Array of values to pad
direction (series Direction) : Direction to apply padding
both_period (int) : Optional - periods to pad in both directions. Overrides forward_period and backward_period if specified
forward_period (int) : Optional - periods to pad forward. Defaults to array length if not specified
backward_period (int) : Optional - periods to pad backward. Defaults to array length if not specified
Returns: Array ordered with most recent point at index 0, containing original data with symmetric padding applied
reflect(source, series_length, direction, both_period, forward_period, backward_period)
Applies reflect padding by continuing trends through reflection around endpoint values
Parameters:
source (float) : Input value to pad from
series_length (int) : Length of the data window
direction (series Direction) : Direction to apply padding
both_period (int) : Optional - periods to pad in both directions. Overrides forward_period and backward_period if specified
forward_period (int) : Optional - periods to pad forward. Defaults to series_length if not specified
backward_period (int) : Optional - periods to pad backward. Defaults to series_length if not specified
Returns: Array ordered with most recent point at index 0, containing original data with reflect padding applied
method reflect(source, direction, both_period, forward_period, backward_period)
Applies reflect padding to an array by continuing trends through reflection around endpoint values
Namespace types: array
Parameters:
source (array) : Array of values to pad
direction (series Direction) : Direction to apply padding
both_period (int) : Optional - periods to pad in both directions. Overrides forward_period and backward_period if specified
forward_period (int) : Optional - periods to pad forward. Defaults to array length if not specified
backward_period (int) : Optional - periods to pad backward. Defaults to array length if not specified
Returns: Array ordered with most recent point at index 0, containing original data with reflect padding applied
periodic(source, series_length, direction, both_period, forward_period, backward_period)
Applies periodic padding by repeating the input data
Parameters:
source (float) : Input value to pad from
series_length (int) : Length of the data window
direction (series Direction) : Direction to apply padding
both_period (int) : Optional - periods to pad in both directions. Overrides forward_period and backward_period if specified
forward_period (int) : Optional - periods to pad forward. Defaults to series_length if not specified
backward_period (int) : Optional - periods to pad backward. Defaults to series_length if not specified
Returns: Array ordered with most recent point at index 0, containing original data with periodic padding applied
method periodic(source, direction, both_period, forward_period, backward_period)
Applies periodic padding to an array by repeating the data
Namespace types: array
Parameters:
source (array) : Array of values to pad
direction (series Direction) : Direction to apply padding
both_period (int) : Optional - periods to pad in both directions. Overrides forward_period and backward_period if specified
forward_period (int) : Optional - periods to pad forward. Defaults to array length if not specified
backward_period (int) : Optional - periods to pad backward. Defaults to array length if not specified
Returns: Array ordered with most recent point at index 0, containing original data with periodic padding applied
antisymmetric(source, series_length, direction, both_period, forward_period, backward_period)
Applies antisymmetric padding by mirroring data and alternating signs
Parameters:
source (float) : Input value to pad from
series_length (int) : Length of the data window
direction (series Direction) : Direction to apply padding
both_period (int) : Optional - periods to pad in both directions. Overrides forward_period and backward_period if specified
forward_period (int) : Optional - periods to pad forward. Defaults to series_length if not specified
backward_period (int) : Optional - periods to pad backward. Defaults to series_length if not specified
Returns: Array ordered with most recent point at index 0, containing original data with antisymmetric padding applied
method antisymmetric(source, direction, both_period, forward_period, backward_period)
Applies antisymmetric padding to an array by mirroring data and alternating signs
Namespace types: array
Parameters:
source (array) : Array of values to pad
direction (series Direction) : Direction to apply padding
both_period (int) : Optional - periods to pad in both directions. Overrides forward_period and backward_period if specified
forward_period (int) : Optional - periods to pad forward. Defaults to array length if not specified
backward_period (int) : Optional - periods to pad backward. Defaults to array length if not specified
Returns: Array ordered with most recent point at index 0, containing original data with antisymmetric padding applied
antireflect(source, series_length, direction, both_period, forward_period, backward_period)
Applies antireflect padding by reflecting around endpoints while preserving derivatives
Parameters:
source (float) : Input value to pad from
series_length (int) : Length of the data window
direction (series Direction) : Direction to apply padding
both_period (int) : Optional - periods to pad in both directions. Overrides forward_period and backward_period if specified
forward_period (int) : Optional - periods to pad forward. Defaults to series_length if not specified
backward_period (int) : Optional - periods to pad backward. Defaults to series_length if not specified
Returns: Array ordered with most recent point at index 0, containing original data with antireflect padding applied
method antireflect(source, direction, both_period, forward_period, backward_period)
Applies antireflect padding to an array by reflecting around endpoints while preserving derivatives
Namespace types: array
Parameters:
source (array) : Array of values to pad
direction (series Direction) : Direction to apply padding
both_period (int) : Optional - periods to pad in both directions. Overrides forward_period and backward_period if specified
forward_period (int) : Optional - periods to pad forward. Defaults to array length if not specified
backward_period (int) : Optional - periods to pad backward. Defaults to array length if not specified
Returns: Array ordered with most recent point at index 0, containing original data with antireflect padding applied. Note: Last data point is lost when using array input
smooth(source, series_length, direction, both_period, forward_period, backward_period)
Applies smooth padding by extending with constant derivatives from endpoints
Parameters:
source (float) : Input value to pad from
series_length (int) : Length of the data window
direction (series Direction) : Direction to apply padding
both_period (int) : Optional - periods to pad in both directions. Overrides forward_period and backward_period if specified
forward_period (int) : Optional - periods to pad forward. Defaults to series_length if not specified
backward_period (int) : Optional - periods to pad backward. Defaults to series_length if not specified
Returns: Array ordered with most recent point at index 0, containing original data with smooth padding applied
method smooth(source, direction, both_period, forward_period, backward_period)
Applies smooth padding to an array by extending with constant derivatives from endpoints
Namespace types: array
Parameters:
source (array) : Array of values to pad
direction (series Direction) : Direction to apply padding
both_period (int) : Optional - periods to pad in both directions. Overrides forward_period and backward_period if specified
forward_period (int) : Optional - periods to pad forward. Defaults to array length if not specified
backward_period (int) : Optional - periods to pad backward. Defaults to array length if not specified
Returns: Array ordered with most recent point at index 0, containing original data with smooth padding applied. Note: Last data point is lost when using array input
constant(source, series_length, direction, both_period, forward_period, backward_period)
Applies constant padding by extending endpoint values
Parameters:
source (float) : Input value to pad from
series_length (int) : Length of the data window
direction (series Direction) : Direction to apply padding
both_period (int) : Optional - periods to pad in both directions. Overrides forward_period and backward_period if specified
forward_period (int) : Optional - periods to pad forward. Defaults to series_length if not specified
backward_period (int) : Optional - periods to pad backward. Defaults to series_length if not specified
Returns: Array ordered with most recent point at index 0, containing original data with constant padding applied
method constant(source, direction, both_period, forward_period, backward_period)
Applies constant padding to an array by extending endpoint values
Namespace types: array
Parameters:
source (array) : Array of values to pad
direction (series Direction) : Direction to apply padding
both_period (int) : Optional - periods to pad in both directions. Overrides forward_period and backward_period if specified
forward_period (int) : Optional - periods to pad forward. Defaults to array length if not specified
backward_period (int) : Optional - periods to pad backward. Defaults to array length if not specified
Returns: Array ordered with most recent point at index 0, containing original data with constant padding applied
zero(source, series_length, direction, both_period, forward_period, backward_period)
Applies zero padding by extending with zeros
Parameters:
source (float) : Input value to pad from
series_length (int) : Length of the data window
direction (series Direction) : Direction to apply padding
both_period (int) : Optional - periods to pad in both directions. Overrides forward_period and backward_period if specified
forward_period (int) : Optional - periods to pad forward. Defaults to series_length if not specified
backward_period (int) : Optional - periods to pad backward. Defaults to series_length if not specified
Returns: Array ordered with most recent point at index 0, containing original data with zero padding applied
method zero(source, direction, both_period, forward_period, backward_period)
Applies zero padding to an array by extending with zeros
Namespace types: array
Parameters:
source (array) : Array of values to pad
direction (series Direction) : Direction to apply padding
both_period (int) : Optional - periods to pad in both directions. Overrides forward_period and backward_period if specified
forward_period (int) : Optional - periods to pad forward. Defaults to array length if not specified
backward_period (int) : Optional - periods to pad backward. Defaults to array length if not specified
Returns: Array ordered with most recent point at index 0, containing original data with zero padding applied
pad_data(source, series_length, padding_type, direction, both_period, forward_period, backward_period)
Generic padding function that applies specified padding type to input data
Parameters:
source (float) : Input value to pad from
series_length (int) : Length of the data window
padding_type (series PaddingType) : Type of padding to apply (see PaddingType enum)
direction (series Direction) : Direction to apply padding
both_period (int) : Optional - periods to pad in both directions. Overrides forward_period and backward_period if specified
forward_period (int) : Optional - periods to pad forward. Defaults to series_length if not specified
backward_period (int) : Optional - periods to pad backward. Defaults to series_length if not specified
Returns: Array ordered with most recent point at index 0, containing original data with specified padding applied
method pad_data(source, padding_type, direction, both_period, forward_period, backward_period)
Generic padding function that applies specified padding type to array input
Namespace types: array
Parameters:
source (array) : Array of values to pad
padding_type (series PaddingType) : Type of padding to apply (see PaddingType enum)
direction (series Direction) : Direction to apply padding
both_period (int) : Optional - periods to pad in both directions. Overrides forward_period and backward_period if specified
forward_period (int) : Optional - periods to pad forward. Defaults to array length if not specified
backward_period (int) : Optional - periods to pad backward. Defaults to array length if not specified
Returns: Array ordered with most recent point at index 0, containing original data with specified padding applied. Note: Last data point is lost when using antireflect or smooth padding types
make_padded_data(source, series_length, padding_type, direction, both_period, forward_period, backward_period)
Creates a window-based padded data series that updates with each new value. WARNING: Function must be called on every bar for consistency. Do not use in scopes where it may not execute on every bar.
Parameters:
source (float) : Input value to pad from
series_length (int) : Length of the data window
padding_type (series PaddingType) : Type of padding to apply (see PaddingType enum)
direction (series Direction) : Direction to apply padding
both_period (int) : Optional - periods to pad in both directions. Overrides forward_period and backward_period if specified
forward_period (int) : Optional - periods to pad forward. Defaults to series_length if not specified
backward_period (int) : Optional - periods to pad backward. Defaults to series_length if not specified
Returns: Array ordered with most recent point at index 0, containing windowed data with specified padding applied
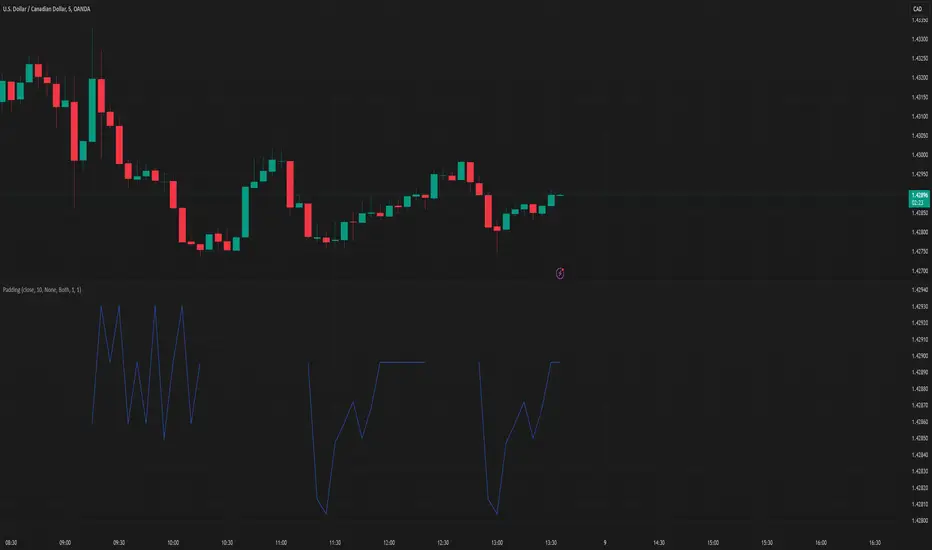
UtilityLibraryLibrary "UtilityLibrary"
A collection of custom utility functions used in my scripts.
milliseconds_per_bar()
Gets the number of milliseconds per bar.
Returns: (int) The number of milliseconds per bar.
realtime()
Checks if the current bar is the actual realtime bar.
Returns: (bool) `true` when the current bar is the actual realtime bar, `false` otherwise.
replay()
Checks if the current bar is the last replay bar.
Returns: (bool) `true` when the current bar is the last replay bar, `false` otherwise.
bar_elapsed()
Checks how much of the current bar has elapsed.
Returns: (float) Between 0 and 1.
even(number)
Checks if a number is even.
Parameters:
number (float) : (float) The number to evaluate.
Returns: (bool) `true` when the number is even, `false` when the number is odd.
sign(number)
Gets the sign of a float.
Parameters:
number (float) : (float) The number to evaluate.
Returns: (int) 1 or -1, unlike math.sign() which returns 0 if the number is 0.
atan2(y, x)
Derives an angle in radians from the XY coordinate.
Parameters:
y (float) : (float) Y coordinate.
x (float) : (float) X coordinate.
Returns: (float) Between -π and π.
clamp(number, min, max)
Ensures a value is between the `min` and `max` thresholds.
Parameters:
number (float) : (float) The number to clamp.
min (float) : (float) The minimum threshold (0 by default).
max (float) : (float) The maximum threshold (1 by default).
Returns: (float) Between `min` and `max`.
remove_gamma(value)
Removes gamma from normalized sRGB channel values.
Parameters:
value (float) : (float) The normalized channel value .
Returns: (float) Channel value with gamma removed.
add_gama(value)
Adds gamma into normalized linear RGB channel values.
Parameters:
value (float) : (float) The normalized channel value .
Returns: (float) Channel value with gamma added.
rgb_to_xyz(Color)
Extracts XYZ-D65 channels from sRGB colors.
Parameters:
Color (color) : (color) The sRGB color to process.
Returns: (float tuple)
xyz_to_rgb(x, y, z)
Converts XYZ-D65 channels to sRGB channels.
Parameters:
x (float) : (float) The X channel value.
y (float) : (float) The Y channel value.
z (float) : (float) The Z channel value.
Returns: (int tuple)
rgb_to_oklab(Color)
Extracts OKLAB-D65 channels from sRGB colors.
Parameters:
Color (color) : (color) The sRGB color to process.
Returns: (float tuple)
oklab_to_rgb(l, a, b)
Converts OKLAB-D65 channels to sRGB channels.
Parameters:
l (float) : (float) The L channel value.
a (float) : (float) The A channel value.
b (float) : (float) The B channel value.
Returns: (int tuple)
rgb_to_oklch(Color)
Extracts OKLCH channels from sRGB colors.
Parameters:
Color (color) : (color) The sRGB color to process.
Returns: (float tuple)
oklch_to_rgb(l, c, h)
Converts OKLCH channels to sRGB channels.
Parameters:
l (float) : (float) The L channel value.
c (float) : (float) The C channel value.
h (float) : (float) The H channel value.
Returns: (float tuple)
hues(l1, h1, l2, h2, dist)
Ensures the hue angles are set correctly for linearly interpolating OKLCH.
Parameters:
l1 (float) : (float) The first L channel value.
h1 (float) : (float) The first H channel value.
l2 (float) : (float) The second L channel value.
h2 (float) : (float) The second H channel value.
dist (string) : (string) The preferred angular distance to use. Options: `min` or `max` (`min` by default).
Returns: (float tuple)
lerp(a, b, t)
Linearly interpolates between two values.
Parameters:
a (float) : (float) The starting point (first value).
b (float) : (float) The ending point (second value).
t (float) : (float) The interpolation factor .
Returns: (float) Between `a` and `b`.
smoothstep(t, precise)
A non-linear (smooth) interpolation between 0 and 1.
Parameters:
t (float) : (float) The interpolation factor .
precise (bool) : (bool) Sets if the calc should be precise or efficient (`true` by default).
Returns: (float) Between 0 and 1.
ease(t, n, v, x1, y1, x2, y2)
A customizable non-linear interpolation between 0 and 1.
Parameters:
t (float) : (float) The interpolation factor .
n (float) : (float) The degree of ease (1 by default).
v (string) : (string) The easing variant type: `in-out`, `in`, or `out` (`in-out` by default).
x1 (float) : (float) Optional X coordinate of starting point (0 by default).
y1 (float) : (float) Optional Y coordinate of starting point (0 by default).
x2 (float) : (float) Optional X coordinate of ending point (1 by default).
y2 (float) : (float) Optional Y coordinate of ending point (1 by default).
Returns: (float) Between 0 and 1.
mix(color1, color2, blend, space, dist)
Linearly interpolates between two colors.
Parameters:
color1 (color) : (color) The first color.
color2 (color) : (color) The second color.
blend (float) : (float) The interpolation factor .
space (string) : (string) The color space to use for interpolating. Options: `rgb`, `oklab`, and `oklch` (`rgb` by default).
dist (string) : (string) The anglular distance to use for the hue change when the color space is set to `oklch`. Options: `min` and `max` (`min` by default).
Returns: (color) Blend of `color1` and `color2`.

waves█ OVERVIEW
This library intended for use in Bar Replay provides functions to generate various wave forms (sine, cosine, triangle, square) based on time and customizable parameters. Useful for testing and in creating oscillators, indicators, or visual effects.
█ FUNCTIONS
• getSineWave()
• getCosineWave()
• getTriangleWave()
• getSquareWave()
█ USAGE EXAMPLE
//@version=6
indicator("Wave Example")
import kaigouthro/waves/1
plot(waves.getSineWave(cyclesPerMinute=15))
█ NOTES
* barsPerSecond defaults to 10. Adjust this if not using 10x in Bar Replay.
* Phase shift is in degrees.
---
Library "waves"
getSineWave(cyclesPerMinute, bar, barsPerSecond, amplitude, verticalShift, phaseShift)
`getSineWave`
> Calculates a sine wave based on bar index, cycles per minute (BPM), and wave parameters.
Parameters:
cyclesPerMinute (float) : (float) The desired number of cycles per minute (BPM). Default is 30.0.
bar (int) : (int) The current bar index. Default is bar_index.
barsPerSecond (float) : (float) The number of bars per second. Default is 10.0 for Bar Replay
amplitude (float) : (float) The amplitude of the sine wave. Default is 1.0.
verticalShift (float) : (float) The vertical shift of the sine wave. Default is 0.0.
phaseShift (float) : (float) The phase shift of the sine wave in radians. Default is 0.0.
Returns: (float) The calculated sine wave value.
getCosineWave(cyclesPerMinute, bar, barsPerSecond, amplitude, verticalShift, phaseShift)
`getCosineWave`
> Calculates a cosine wave based on bar index, cycles per minute (BPM), and wave parameters.
Parameters:
cyclesPerMinute (float) : (float) The desired number of cycles per minute (BPM). Default is 30.0.
bar (int) : (int) The current bar index. Default is bar_index.
barsPerSecond (float) : (float) The number of bars per second. Default is 10.0 for Bar Replay
amplitude (float) : (float) The amplitude of the cosine wave. Default is 1.0.
verticalShift (float) : (float) The vertical shift of the cosine wave. Default is 0.0.
phaseShift (float) : (float) The phase shift of the cosine wave in radians. Default is 0.0.
Returns: (float) The calculated cosine wave value.
getTriangleWave(cyclesPerMinute, bar, barsPerSecond, amplitude, verticalShift, phaseShift)
`getTriangleWave`
> Calculates a triangle wave based on bar index, cycles per minute (BPM), and wave parameters.
Parameters:
cyclesPerMinute (float) : (float) The desired number of cycles per minute (BPM). Default is 30.0.
bar (int) : (int) The current bar index. Default is bar_index.
barsPerSecond (float) : (float) The number of bars per second. Default is 10.0 for Bar Replay
amplitude (float) : (float) The amplitude of the triangle wave. Default is 1.0.
verticalShift (float) : (float) The vertical shift of the triangle wave. Default is 0.0.
phaseShift (float) : (float) The phase shift of the triangle wave in radians. Default is 0.0.
Returns: (float) The calculated triangle wave value.
getSquareWave(cyclesPerMinute, bar, barsPerSecond, amplitude, verticalShift, dutyCycle, phaseShift)
`getSquareWave`
> Calculates a square wave based on bar index, cycles per minute (BPM), and wave parameters.
Parameters:
cyclesPerMinute (float) : (float) The desired number of cycles per minute (BPM). Default is 30.0.
bar (int) : (int) The current bar index. Default is bar_index.
barsPerSecond (float) : (float) The number of bars per second. Default is 10.0 for Bar Replay
amplitude (float) : (float) The amplitude of the square wave. Default is 1.0.
verticalShift (float) : (float) The vertical shift of the square wave. Default is 0.0.
dutyCycle (float) : (float) The duty cycle of the square wave (0.0 to 1.0). Default is 0.5 (50% duty cycle).
phaseShift (float) : (float) The phase shift of the square wave in radians. Default is 0.0.
Returns: (float) The calculated square wave value.
