OPEN-SOURCE SCRIPT
Telah dikemas kini TrendZone
TrendZone - Fibonacci Trendline Indicator
TrendZone is a custom Pine Script indicator that automatically draws fibonacci-based trendlines between key pivot points on your chart.
Key Features:
3 Pivot Points: Set start point, major pivot (reversal), and end point
Dual Trendlines: First trendline (Point 1 → 2) and second trendline (Point 2 → 3)
Fibonacci Levels: Automatically draws 25%, 50%, and 100% fibonacci levels for each trendline
Auto Trend Detection: Automatically identifies bullish/bearish trends and adjusts colors accordingly
Customizable: Full control over colors, line styles, and widths for each fibonacci level
How it Works:
The indicator uses your selected pivot points to create two connected trendline systems. Point 2 serves as the major pivot where the first trend ends and the reversal begins. Each trendline system includes fibonacci retracement levels that extend to the right, helping identify potential support/resistance zones.
Use Cases:
Identifying trend reversals at key pivot points
Finding potential support/resistance levels using fibonacci projections
Visualizing market structure changes between different time periods
Planning entries/exits based on fibonacci trendline interactions
Perfect for traders who use fibonacci analysis combined with trend structure to identify high-probability trading zones.
Nota Keluaran
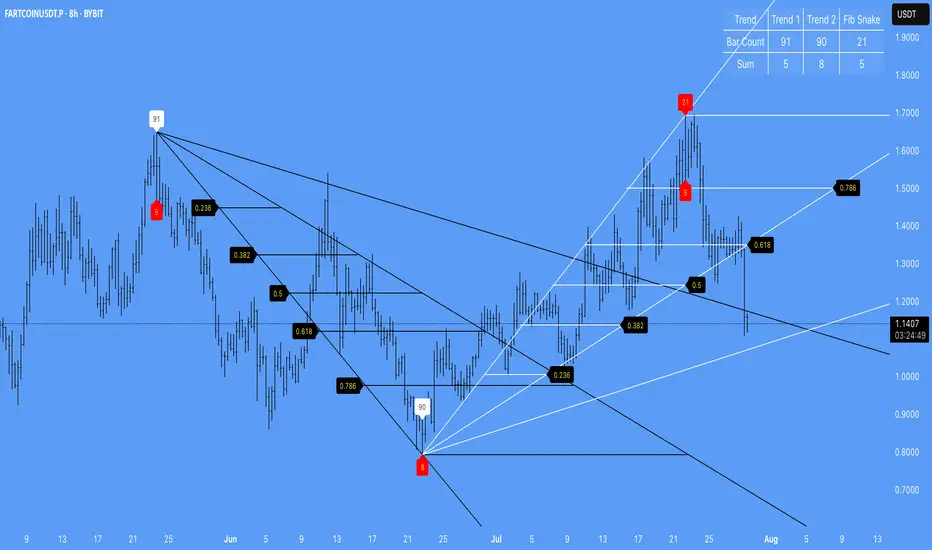
** Table Info added **What the Table Calculates:
The table tracks time and price numerology across three trend segments defined by your pivot points:
Trend 1: From Pivot Point 1 to Pivot Point 2
Trend 2: From Pivot Point 2 to Pivot Point 3
Fib Snake: From Pivot Point 2 to current bar (live updating)
Two Key Measurements:
Bar Count: Number of bars (time periods) in each trend segment
Sum: Numerology reduction of price ranges - converts price movements to single digits (1-9) by adding all digits together until reaching a single digit
Gann Theory Application:
This table is specifically designed for Gann analysis, which heavily emphasized:
Time/Price Relationships: Gann believed certain time periods and price movements had mystical significance
Numerology: He used digit reduction (what this "Sum" row does) to find hidden patterns in price movements
Fibonacci Sequences: Sacred numbers that appear throughout nature and markets
Visual Significance:
Black text = Fibonacci number detected (1,2,3,5,8,13,21,34,55,89,144,233,377,610,987,1597,2584,4181,6765)
White text = Non-Fibonacci number
Trading Utility:
When bar counts or numerology sums hit Fibonacci numbers (showing in black), Gann theory suggests these are significant turning points or continuation signals. The "Fib Snake" column updates live, so you can watch for when current market action reaches these mathematically significant levels.
This combines Gann's time-price numerology with modern Fibonacci analysis for confluence trading signals.
Nota Keluaran
** Small update **Tables on mobile displays look cluttered. You can turn the table off and use the values directly on the chart now if you wish.
Also - hot tip: If you click on the trend lines you can move them about directly on the chart using the built in handles.
Please know that that this is made to be used on a set timeframe. Changing timeframes will mean you need to re-position to display.
Nota Keluaran
Fixed a small display bug when chart refreshedNota Keluaran
Updated label handling Pivot 1 labels = Trend bar count (above) and Sum of price in range (below)
Pivot 2 labels = Trend bar count (above) and Sum of price in range (below)
Pivot 3 labels = Trend bar count to latest closed bar (above) and Sum of this price range (below)
Nota Keluaran
A sum value of "9" with be highlighted now. An important number in numerology and a potential reversal is happening. Nota Keluaran
Added Special Matching Logic for Specific Numerological Breakpoints for any values that sum to 9.This mirrors the existing logic for sum=9 but uses different colours and applies to bar counts for any counts that sum to 9.
For example a bar count of 81 would be 8+1=9
Nota Keluaran
Now you get a fib retracement levels automatically in-between the trendline system. Nota Keluaran
The script has been updated for a cleaner look. Nota Keluaran
It was missing the 0 and 1 fib retracement line. FIXEDNota Keluaran
Fib Retracement levels are now available for both trends. Nota Keluaran
Updated to use Bar Index instead of time. There was issues with stocks when the market was not open. Should be more consistent now.
NOTE: there is a limit to how many bars the range can cover. If it fails, you will need to go to a higher time frame.
Nota Keluaran
Consolidated colours. Small fixes Nota Keluaran
Due to several requests, traders wished to have their own custom levels including projections beyond the 1 level. Now you can set your own custom fib levels. Updated. Nota Keluaran
Small update. Custom colour for fib number detection added. Nota Keluaran
Fib Label offsets now work for both sides. FIXED. Skrip sumber terbuka
Dalam semangat TradingView sebenar, pencipta skrip ini telah menjadikannya sumber terbuka, jadi pedagang boleh menilai dan mengesahkan kefungsiannya. Terima kasih kepada penulis! Walaupuan anda boleh menggunakan secara percuma, ingat bahawa penerbitan semula kod ini tertakluk kepada Peraturan Dalaman.
Penafian
Maklumat dan penerbitan adalah tidak bertujuan, dan tidak membentuk, nasihat atau cadangan kewangan, pelaburan, dagangan atau jenis lain yang diberikan atau disahkan oleh TradingView. Baca lebih dalam Terma Penggunaan.
Skrip sumber terbuka
Dalam semangat TradingView sebenar, pencipta skrip ini telah menjadikannya sumber terbuka, jadi pedagang boleh menilai dan mengesahkan kefungsiannya. Terima kasih kepada penulis! Walaupuan anda boleh menggunakan secara percuma, ingat bahawa penerbitan semula kod ini tertakluk kepada Peraturan Dalaman.
Penafian
Maklumat dan penerbitan adalah tidak bertujuan, dan tidak membentuk, nasihat atau cadangan kewangan, pelaburan, dagangan atau jenis lain yang diberikan atau disahkan oleh TradingView. Baca lebih dalam Terma Penggunaan.