PROTECTED SOURCE SCRIPT
Telah dikemas kini Coppock Curve Correlation between MTF & Slopes
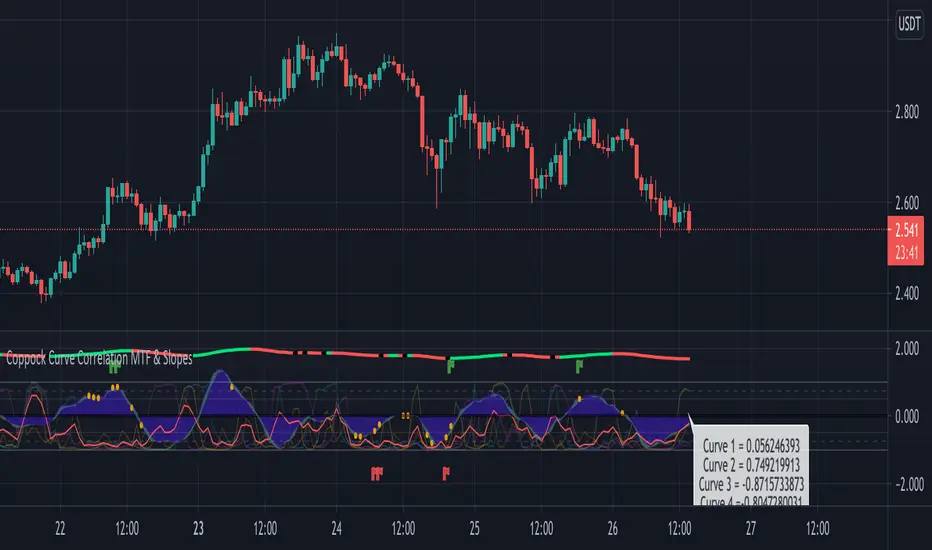
My first tool !
1. The waves shows the slope of the curve. The front one = 3 periods, back one = 2 periods, difference = white area.
2. The moving lines shows the curve correlation between 2x 2 time frames (adjustable on the settings) on 2 periods lookback.
2.1 Theres few regions of high correlation, lines are at (absolute values) 0.5, 0.75, 1
3. On the top there's the Coppock curve -> if falling since 1 period = red, else green.
4. Diamonds shows : if correlation is in the strong correlation area and slope is falling or rising : red or green diamond.
This tool could be interesting to have an idea if there's strong correlation between timeframes instead of watching 4-5 different timeframes !
Nota Keluaran
Changed the conditions for the diamonds to appear : -> If rising/falling and one of the correlation curve is in the strong correlation area -> then diamond !
Nota Keluaran
Update !Added :
- Possible to plot the curve choosing the timeframe.
-> 4 possible correlations of this indicator between 8 timeframes and the live values of the correlation
-> Each time all of the curves are in a zone of high correlation theres a dot plotted : if its positive high correlation : yellow dot. If it's negative high correlation : orange dot.
-> The red curve is an average of the 4 correlation curves.
-> Green or red flags : if 2/4 curves are in a high negative/positive area of high correlation and the curve is rising/falling : green or red flag. (it must be set up to be efficient, i've did a simple back test strategy for long -> with a good stop loss (5-15%) on a low time frame it's possible to reach >60-70% with a drawdown of <25-30%).
Skrip dilindungi
Skrip ini diterbitkan sebagai sumber tertutup. Akan tetapi, anda boleh menggunakannya secara bebas dan tanpa apa-apa had – ketahui lebih di sini.
Penafian
Maklumat dan penerbitan adalah tidak bertujuan, dan tidak membentuk, nasihat atau cadangan kewangan, pelaburan, dagangan atau jenis lain yang diberikan atau disahkan oleh TradingView. Baca lebih dalam Terma Penggunaan.