OPEN-SOURCE SCRIPT
Money Line Approximation
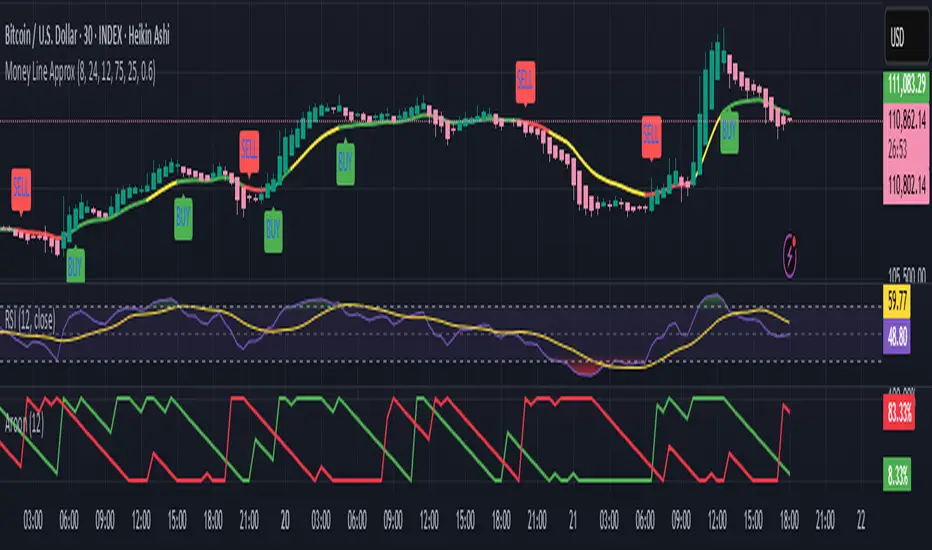
Similar to Ivan's money line minus the Macro data.
How to Interpret and Use It
Bullish Setup: Green line + buy signal = Potential entry (e.g., buy on pullback to the line). Expect upward momentum if RSI stays below 75.
Bearish Setup: Red line + sell signal = Potential exit or short (e.g., sell near the line). Watch for RSI above 25 confirming downside.
Neutral Periods: Yellow line indicates indecision—best to wait for a flip rather than force trades.
Strengths: Simple, visual, and filtered against extremes; works well in trending markets by blending EMAs and using RSI to avoid overbought buys or oversold sells.
Skrip sumber terbuka
Dalam semangat sebenar TradingView, pencipta skrip ini telah menjadikannya sumber terbuka supaya pedagang dapat menilai dan mengesahkan kefungsiannya. Terima kasih kepada penulis! Walaupun anda boleh menggunakannya secara percuma, ingat bahawa menerbitkan semula kod ini adalah tertakluk kepada Peraturan Dalaman kami.
Penafian
Maklumat dan penerbitan adalah tidak dimaksudkan untuk menjadi, dan tidak membentuk, nasihat untuk kewangan, pelaburan, perdagangan dan jenis-jenis lain atau cadangan yang dibekalkan atau disahkan oleh TradingView. Baca dengan lebih lanjut di Terma Penggunaan.