OPEN-SOURCE SCRIPT
Telah dikemas kini Average Pivot Range - JD
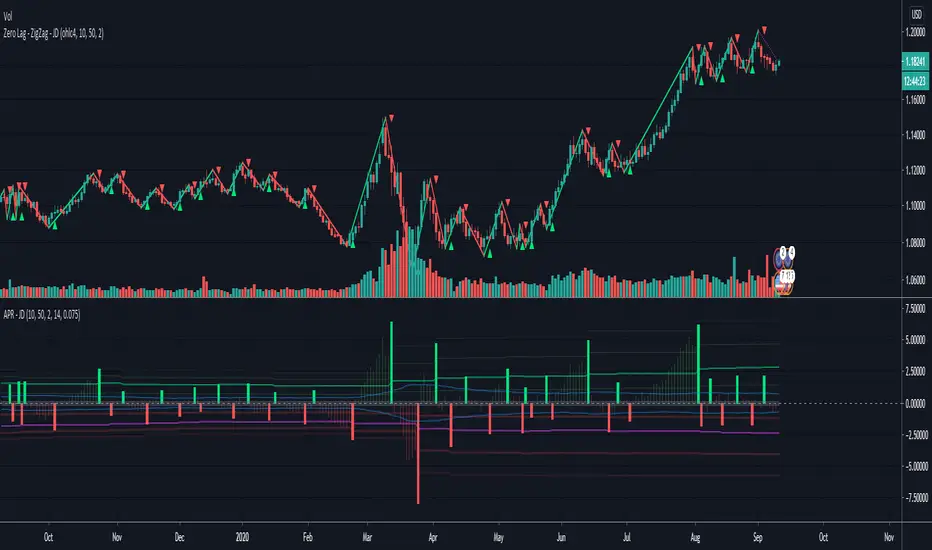
The "Average Pivot Indicator" is an alternative to the "Average True Range"
and is based in "pivot points" calculated with a Jurik ma, (same as the "Zero-Lag"ZigZag")
the indicator calculates the range in the price swing between the two last pivot points.
A green/red candle shows the range that price has risen/fallen since the last swing low/high
As with the normal ATR, this can be used to set price targets, stoplosses, to gauge volatility,...
I added an option to insert a commission/fee percentage to make it easy to see if a timeframe is worth trading
or if you will likely get "eaten" by fees.
(note the fee should be entered per transaction!! The indicator will calculate it one time for entry and once for exit)
The indicator can be displayed in percentage (upper chart) or in absolute value/ticks (lower chart)
The normal ATR is added too, so you don't have to chose which one you add to your chart! ;-)
if you find other uses, please leave your ideas in the comments!
Shoutout to Everget for the awesome Jurik code!!
JD.
#NotTradingAdvice
#DYOR
I build these indicators for myself and provide them open source, to use for free to use and improve upon,
as I believe the best way to learn is toghether.
Nota Keluaran
- cooked up a method to calculate the APR more exactly by averaging only the non na values!- added standard deviation bands to the average
Nota Keluaran
Code cleanup.Nota Keluaran
update to v4.Nota Keluaran
UPDATED WITH THE USE OF ARRAYS !!Enjoy!
Gr, JD.
Skrip sumber terbuka
Dalam semangat TradingView sebenar, pencipta skrip ini telah menjadikannya sumber terbuka, jadi pedagang boleh menilai dan mengesahkan kefungsiannya. Terima kasih kepada penulis! Walaupuan anda boleh menggunakan secara percuma, ingat bahawa penerbitan semula kod ini tertakluk kepada Peraturan Dalaman.
Disclaimer.
I AM NOT A FINANCIAL ADVISOR.
THESE IDEAS ARE NOT ADVICE AND ARE FOR EDUCATION PURPOSES ONLY.
ALWAYS DO YOUR OWN RESEARCH!
JD.
You can contact me for info/access in PM or on Telegram: @jduyck
PLS, DON'T ASK FOR ACCESS IN THE COMMENT SECTION!
I AM NOT A FINANCIAL ADVISOR.
THESE IDEAS ARE NOT ADVICE AND ARE FOR EDUCATION PURPOSES ONLY.
ALWAYS DO YOUR OWN RESEARCH!
JD.
You can contact me for info/access in PM or on Telegram: @jduyck
PLS, DON'T ASK FOR ACCESS IN THE COMMENT SECTION!
Penafian
Maklumat dan penerbitan adalah tidak bertujuan, dan tidak membentuk, nasihat atau cadangan kewangan, pelaburan, dagangan atau jenis lain yang diberikan atau disahkan oleh TradingView. Baca lebih dalam Terma Penggunaan.
Skrip sumber terbuka
Dalam semangat TradingView sebenar, pencipta skrip ini telah menjadikannya sumber terbuka, jadi pedagang boleh menilai dan mengesahkan kefungsiannya. Terima kasih kepada penulis! Walaupuan anda boleh menggunakan secara percuma, ingat bahawa penerbitan semula kod ini tertakluk kepada Peraturan Dalaman.
Penafian
Maklumat dan penerbitan adalah tidak bertujuan, dan tidak membentuk, nasihat atau cadangan kewangan, pelaburan, dagangan atau jenis lain yang diberikan atau disahkan oleh TradingView. Baca lebih dalam Terma Penggunaan.