OPEN-SOURCE SCRIPT
Telah dikemas kini High/Low Break Alert
Use for bias direction of trend.
Suitable for H4 and above.
Suitable for H4 and above.
Nota Keluaran
Added- high/low price line
- high/low price at the previous candle
- edit fuction etc.
Nota Keluaran
Added- You can select a timeframe to display the highest and lowest prices
for the selected timeframe.
Nota Keluaran
UpdatedNota Keluaran
Added- Multi timeframe (main & sub)
Nota Keluaran
UpdatedNota Keluaran
UpdatedNota Keluaran
UpdatedNota Keluaran
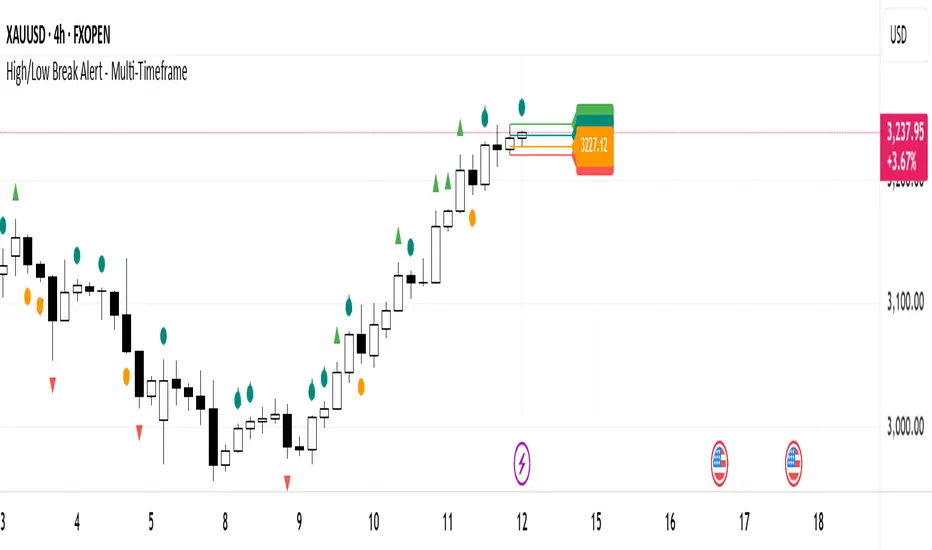
This tool helps identify price trends using the breakout principle based on the high/low of the most recently closed candlestick. It automatically displays breakout points on the chart, along with lines marking the previous candle's high and low as key breakout reference levels.The tool is best suited for timeframes from H4 and above. The analysis logic is as follows:
For an uptrend:
- If the current candle closes above the high of the previous closed candle, it is inferred that the price is likely to continue rising.
For a downtrend:
- If the current candle closes below the low of the previous closed candle, it is inferred that the price is likely to continue falling.
Usage Instructions:
- Once activated, the tool will automatically plot breakout points and focus price lines on the chart. You can freely customize the settings to choose which timeframe(s) to monitor for breakouts, change the color scheme, or modify the breakout symbol.
However, it is recommended to use timeframes of H4 or higher, as higher timeframes generally offer more reliable signals and better risk-to-reward opportunities. In contrast, lower timeframes (LTF) tend to produce more false breakouts.
- When a breakout is identified, trade in the direction of the current trend only. For example:
In an uptrend, take only buy trades.
In a downtrend, take only sell trades.
Entry Strategy for an Uptrend
- Wait for a pullback in a lower timeframe (e.g., M30).
- Then switch to an even lower timeframe (e.g., M15 or M5) and look for a bullish reversal.
- At that point, you can either use the same breakout principle again or apply your preferred reversal technique.
Entry Strategy for a Downtrend
- Wait for a pullback or price bounce in a lower timeframe (e.g., M30).
- Then switch to an even lower timeframe (e.g., M15 or M5) and look for a bearish reversal.
- At that point, you can either use the same breakout principle again or apply your preferred reversal technique.
Using the Tool in a Multi-Timeframe Setup
- The same principle applies.
- You can visualize focus points from two different timeframes simultaneously on a single chart, giving you a broader context for your decisions.
This tool is built upon the principles of naked chart trading — simple and clean without clutter.
I created it to make analysis easier, highlight clear focus points, and help traders make more confident decisions with less guesswork.
Created by PVBabyFather (Ittipon Phara)
Skrip sumber terbuka
Dalam semangat TradingView sebenar, pencipta skrip ini telah menjadikannya sumber terbuka, jadi pedagang boleh menilai dan mengesahkan kefungsiannya. Terima kasih kepada penulis! Walaupuan anda boleh menggunakan secara percuma, ingat bahawa penerbitan semula kod ini tertakluk kepada Peraturan Dalaman.
Penafian
Maklumat dan penerbitan adalah tidak bertujuan, dan tidak membentuk, nasihat atau cadangan kewangan, pelaburan, dagangan atau jenis lain yang diberikan atau disahkan oleh TradingView. Baca lebih dalam Terma Penggunaan.