OPEN-SOURCE SCRIPT
Telah dikemas kini Opening Score with Divergence
Overview
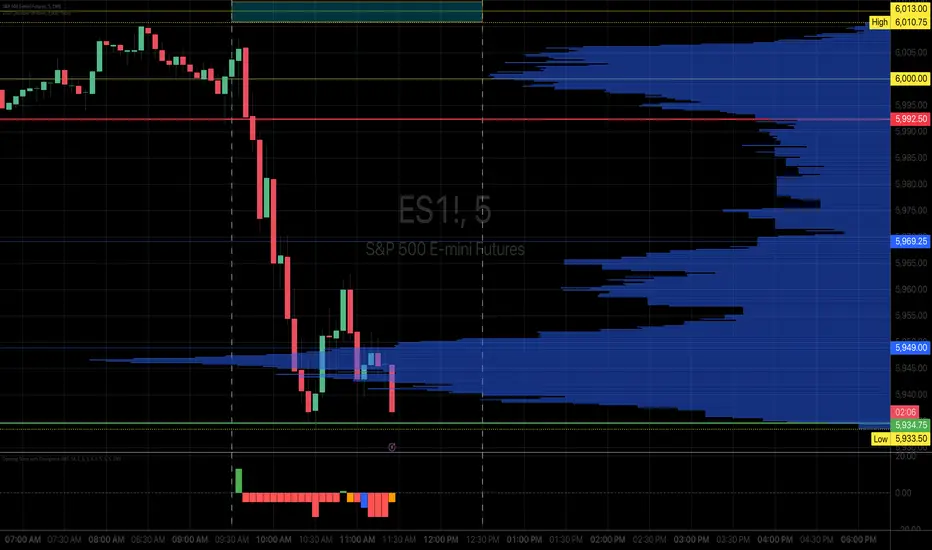
The Opening Score Indicator is a versatile tool designed to help traders assess market sentiment, trend direction, and potential reversals. By combining Opening Range Breakout (ORB), VWAP, Trend, Volatility, and Divergence Detection, this indicator provides a composite score that adapts to different market conditions.
This version includes divergence detection between the Opening Score and price, which highlights potential trend reversals or continuations before they happen. When a regular divergence occurs, the histogram bar turns orange, signaling an increased probability of a trend change.
Best for Both Intraday & Longer-Term Charts
📊 Optimized for intraday trading → Works well on 1m to 30m timeframes for short-term strategies.
📈 Also effective on longer-term charts → Can be used on 1-hour, 4-hour, daily, or weekly charts to identify macro trends and momentum shifts.
🕰️ Adapts to different market conditions → Whether you’re a day trader, swing trader, or position trader, the Opening Score helps you track trend health and reversals.
How It Works
📊 Composite Opening Score Calculation
• ORB Signal → Detects bullish/bearish breakouts based on the opening range.
• VWAP Signal → Measures price positioning relative to VWAP for trend confirmation.
• Trend Signal → Uses a moving average to determine market direction.
• Volatility Signal → Tracks ATR changes to assess market strength.
• Divergence Detection → Identifies regular and hidden divergences for potential reversals or trend continuation.
🔹 Reversal Alerts with Color-Coded Histogram
• Green Bars → Normal bullish Opening Score.
• Red Bars → Normal bearish Opening Score.
• Orange Bars → Warning! Regular Divergence detected → Possible trend reversal.
🔹 Hidden & Regular Divergence Detection
• Regular Divergence (Reversal Signals)
• 📉 Bearish Regular Divergence → Price makes a Higher High, but Opening Score makes a Lower High → 🔻 Possible Downtrend Reversal.
• 📈 Bullish Regular Divergence → Price makes a Lower Low, but Opening Score makes a Higher Low → 🔼 Possible Uptrend Reversal.
• Hidden Divergence (Trend Continuation Signals)
• 📉 Bearish Hidden Divergence → Price makes a Lower High, but Opening Score makes a Higher High → 🔻 Trend Likely to Continue Down.
• 📈 Bullish Hidden Divergence → Price makes a Higher Low, but Opening Score makes a Lower Low → 🔼 Trend Likely to Continue Up.
How to Use It
✅ Watch for Reversal Alerts (Orange Bars) → These highlight potential market turning points.
✅ Use the Zero Line as a Trend Filter → A score above 0 suggests bullish conditions, while below 0 signals bearish conditions.
✅ Combine with Market Structure & Volume Profile → Works well when paired with support/resistance levels, liquidity zones, and order flow data.
✅ Adjust settings based on timeframe → Increase moving average length & lookback periods for longer-term analysis.
Why Use This Indicator?
🚀 Works for both short-term and long-term traders → Adapts to intraday and higher timeframes.
📊 Multi-Factor Analysis → Combines multiple key market indicators for better accuracy.
🎯 Customizable Weighting → Adjust the influence of each signal to suit your trading style.
✅ No Clutter – Only the Opening Score is plotted → Keeps your chart clean & efficient.
🔔 Recommended for Intraday Trading (1m – 30m) AND Longer-Term Analysis (1H – Weekly) → Use this indicator to enhance your trend detection & reversal strategy! 🚀
Nota Keluaran
OverviewThe Opening Score Indicator is a versatile tool designed to help traders assess market sentiment, trend direction, and potential reversals. By combining Opening Range Breakout (ORB), VWAP, Trend, Volatility, and Divergence Detection, this indicator provides a composite score that adapts to different market conditions.
This version includes divergence detection between the Opening Score and price, which highlights potential trend reversals or continuations before they happen. When a regular divergence occurs, the histogram bar turns orange, signaling an increased probability of a trend change.
Best for Both Intraday & Longer-Term Charts
📊 Optimized for intraday trading → Works well on 1m to 30m timeframes for short-term strategies.
📈 Also effective on longer-term charts → Can be used on 1-hour, 4-hour, daily, or weekly charts to identify macro trends and momentum shifts.
🕰️ Adapts to different market conditions → Whether you’re a day trader, swing trader, or position trader, the Opening Score helps you track trend health and reversals.
How It Works
📊 Composite Opening Score Calculation
• ORB Signal → Detects bullish/bearish breakouts based on the opening range.
• VWAP Signal → Measures price positioning relative to VWAP for trend confirmation.
• Trend Signal → Uses a moving average to determine market direction.
• Volatility Signal → Tracks ATR changes to assess market strength.
• Divergence Detection → Identifies regular and hidden divergences for potential reversals or trend continuation.
🔹 Reversal Alerts with Color-Coded Histogram
• Green Bars → Normal bullish Opening Score.
• Red Bars → Normal bearish Opening Score.
• Orange Bars → Warning! Regular Divergence detected → Possible trend reversal.
🔹 Hidden & Regular Divergence Detection
• Regular Divergence (Reversal Signals)
• 📉 Bearish Regular Divergence → Price makes a Higher High, but Opening Score makes a Lower High → 🔻 Possible Downtrend Reversal.
• 📈 Bullish Regular Divergence → Price makes a Lower Low, but Opening Score makes a Higher Low → 🔼 Possible Uptrend Reversal.
• Hidden Divergence (Trend Continuation Signals)
• 📉 Bearish Hidden Divergence → Price makes a Lower High, but Opening Score makes a Higher High → 🔻 Trend Likely to Continue Down.
• 📈 Bullish Hidden Divergence → Price makes a Higher Low, but Opening Score makes a Lower Low → 🔼 Trend Likely to Continue Up.
How to Use It
✅ Watch for Reversal Alerts (Orange Bars) → These highlight potential market turning points.
✅ Use the Zero Line as a Trend Filter → A score above 0 suggests bullish conditions, while below 0 signals bearish conditions.
✅ Combine with Market Structure & Volume Profile → Works well when paired with support/resistance levels, liquidity zones, and order flow data.
✅ Adjust settings based on timeframe → Increase moving average length & lookback periods for longer-term analysis.
Why Use This Indicator?
🚀 Works for both short-term and long-term traders → Adapts to intraday and higher timeframes.
📊 Multi-Factor Analysis → Combines multiple key market indicators for better accuracy.
🎯 Customizable Weighting → Adjust the influence of each signal to suit your trading style.
✅ No Clutter – Only the Opening Score is plotted → Keeps your chart clean & efficient.
🔔 Recommended for Intraday Trading (1m – 30m) AND Longer-Term Analysis (1H – Weekly) → Use this indicator to enhance your trend detection & reversal strategy! 🚀
Nota Keluaran
Changed the color labeling method in settings, minor changes to the strategies.Skrip sumber terbuka
Dalam semangat TradingView sebenar, pencipta skrip ini telah menjadikannya sumber terbuka, jadi pedagang boleh menilai dan mengesahkan kefungsiannya. Terima kasih kepada penulis! Walaupuan anda boleh menggunakan secara percuma, ingat bahawa penerbitan semula kod ini tertakluk kepada Peraturan Dalaman.
I provide expert guidance for crypto traders using Volume Profile and pattern recognition tech
Penafian
Maklumat dan penerbitan adalah tidak bertujuan, dan tidak membentuk, nasihat atau cadangan kewangan, pelaburan, dagangan atau jenis lain yang diberikan atau disahkan oleh TradingView. Baca lebih dalam Terma Penggunaan.
Skrip sumber terbuka
Dalam semangat TradingView sebenar, pencipta skrip ini telah menjadikannya sumber terbuka, jadi pedagang boleh menilai dan mengesahkan kefungsiannya. Terima kasih kepada penulis! Walaupuan anda boleh menggunakan secara percuma, ingat bahawa penerbitan semula kod ini tertakluk kepada Peraturan Dalaman.
I provide expert guidance for crypto traders using Volume Profile and pattern recognition tech
Penafian
Maklumat dan penerbitan adalah tidak bertujuan, dan tidak membentuk, nasihat atau cadangan kewangan, pelaburan, dagangan atau jenis lain yang diberikan atau disahkan oleh TradingView. Baca lebih dalam Terma Penggunaan.