OPEN-SOURCE SCRIPT
Telah dikemas kini Fractal Corridors
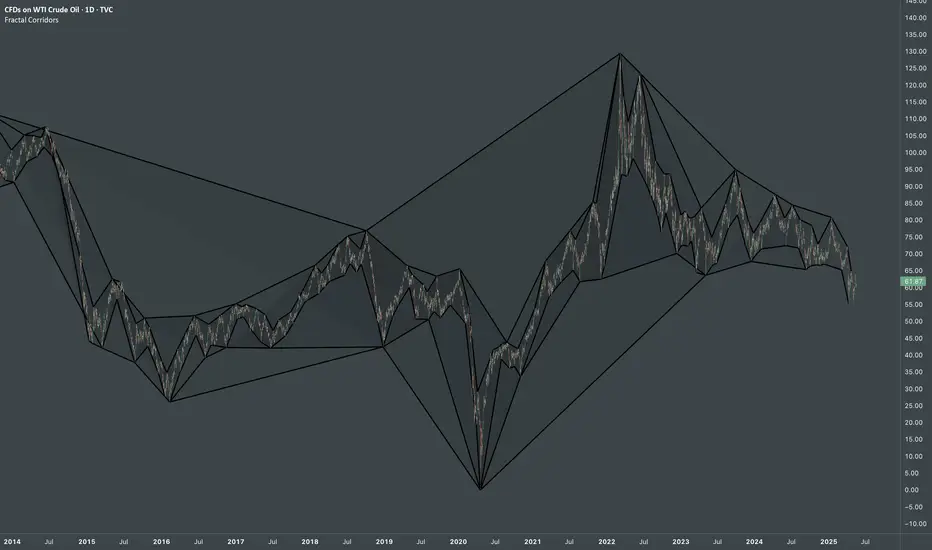
Fractal Corridors - visual tool that maps market structure through a multi-scale lens, revealing the underlying architecture of price action across time. By processing pivot points at multiple depths, it constructs a layered geometric corridors that reflects the self-similar, scalable nature of financial markets. Each pivot scale connects successive highs and lows with lines, and when both sides are present, fills the space between them, forming polygonal bands that shift in shape and density as volatility and trend evolve.
Inputs
The real value of this indicator lies not in generating executive signals, but in offering a structural perspective that blends short-term fluctuations with longer-term market cycles. The output allows to visually assess trends in terms of shapes, detect compression zones, and identify multi-timeframe confluence areas where price is likely to react. Whether used for macro trend confirmation or pattern evaluation, this indicator transforms raw price data into a clear, fractal-informed map of market behavior, helping the user navigate the complexity of emerging price through the language of geometry.
Inputs
- Base Depth: Number of bars for the smallest pivot
- Factor: Multiplier between small, medium and large depths
- Selectable color of components
The real value of this indicator lies not in generating executive signals, but in offering a structural perspective that blends short-term fluctuations with longer-term market cycles. The output allows to visually assess trends in terms of shapes, detect compression zones, and identify multi-timeframe confluence areas where price is likely to react. Whether used for macro trend confirmation or pattern evaluation, this indicator transforms raw price data into a clear, fractal-informed map of market behavior, helping the user navigate the complexity of emerging price through the language of geometry.
Nota Keluaran
Added "external" as alternative fill type that highlights the spacing between multi-scale highs or lows emphasizing external density exposure. This update places particular focus on exposing overall interconnectedness.As a unique visual indicator, this tool requires some explanation. It offers a scalable view of formative market structures that evolve with the trend, revealing how price behaves between phases of tight control and abrupt disorder. The visualization highlights the fractal nature of rhythmic intervals underlying market cadence, where smaller trend components echo the form of larger structures.
Rather than treating price as random noise, this indicator frames it as the emergent output of deeper, self-organizing processes, emphasizing the recursive logic embedded in market behavior.
Skrip sumber terbuka
Dalam semangat TradingView sebenar, pencipta skrip ini telah menjadikannya sumber terbuka, jadi pedagang boleh menilai dan mengesahkan kefungsiannya. Terima kasih kepada penulis! Walaupuan anda boleh menggunakan secara percuma, ingat bahawa penerbitan semula kod ini tertakluk kepada Peraturan Dalaman.
Unlock exclusive tools: fractlab.com
ᴀʟʟ ᴄᴏɴᴛᴇɴᴛ ᴘʀᴏᴠɪᴅᴇᴅ ʙʏ ꜰʀᴀᴄᴛʟᴀʙ ɪꜱ ɪɴᴛᴇɴᴅᴇᴅ ꜰᴏʀ ɪɴꜰᴏʀᴍᴀᴛɪᴏɴᴀʟ ᴀɴᴅ ᴇᴅᴜᴄᴀᴛɪᴏɴᴀʟ ᴘᴜʀᴘᴏꜱᴇꜱ ᴏɴʟʏ.
ᴘᴀꜱᴛ ᴘᴇʀꜰᴏʀᴍᴀɴᴄᴇ ɪꜱ ɴᴏᴛ ɪɴᴅɪᴄᴀᴛɪᴠᴇ ᴏꜰ ꜰᴜᴛᴜʀᴇ ʀᴇꜱᴜʟᴛꜱ.
ᴀʟʟ ᴄᴏɴᴛᴇɴᴛ ᴘʀᴏᴠɪᴅᴇᴅ ʙʏ ꜰʀᴀᴄᴛʟᴀʙ ɪꜱ ɪɴᴛᴇɴᴅᴇᴅ ꜰᴏʀ ɪɴꜰᴏʀᴍᴀᴛɪᴏɴᴀʟ ᴀɴᴅ ᴇᴅᴜᴄᴀᴛɪᴏɴᴀʟ ᴘᴜʀᴘᴏꜱᴇꜱ ᴏɴʟʏ.
ᴘᴀꜱᴛ ᴘᴇʀꜰᴏʀᴍᴀɴᴄᴇ ɪꜱ ɴᴏᴛ ɪɴᴅɪᴄᴀᴛɪᴠᴇ ᴏꜰ ꜰᴜᴛᴜʀᴇ ʀᴇꜱᴜʟᴛꜱ.
Penafian
Maklumat dan penerbitan adalah tidak bertujuan, dan tidak membentuk, nasihat atau cadangan kewangan, pelaburan, dagangan atau jenis lain yang diberikan atau disahkan oleh TradingView. Baca lebih dalam Terma Penggunaan.