OPEN-SOURCE SCRIPT
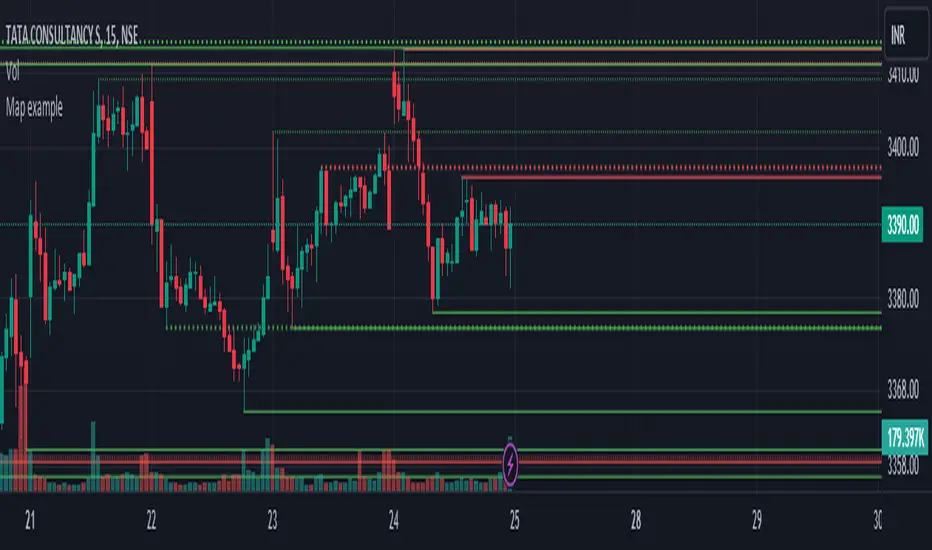
Map example
Using Maps collections:
This code manipulates support and resistance lines using maps collection.
We normally maintain array/udt of lines and related properties to segregate lines as support and or resistance.
With introduction of maps the same can be achieved without creating lines array/udt.
What does this code do:
1. Plot support and resistance lines based on ta.pivothigh() and ta.pivotlow()
2. When price crosses support line, the line is marked as resistance and color is changed to resistance line color and style is changed to dotted line (support turned resistance). Also the width of the line is set based on number of crosses. Finally the support/resistance line is removed when number of times price crossing the line reaches max allowed crosses (input parameter)
Where maps are used:
1. map_sr_cross - Number of times the support/resistance lines has been crossed by price
2. map_sr_type - R=resistance, S=support
3. color_map - color for support and resistance lines
4. style_map - line styles. Support/resistance lines as solid style and support turned resistance/resistance turned support lines as dotted style.
Skrip sumber terbuka
Dalam semangat TradingView sebenar, pencipta skrip ini telah menjadikannya sumber terbuka, jadi pedagang boleh menilai dan mengesahkan kefungsiannya. Terima kasih kepada penulis! Walaupuan anda boleh menggunakan secara percuma, ingat bahawa penerbitan semula kod ini tertakluk kepada Peraturan Dalaman.
Penafian
Maklumat dan penerbitan adalah tidak bertujuan, dan tidak membentuk, nasihat atau cadangan kewangan, pelaburan, dagangan atau jenis lain yang diberikan atau disahkan oleh TradingView. Baca lebih dalam Terma Penggunaan.