Inside Bar (Body-based) Ind/AlertDescription:
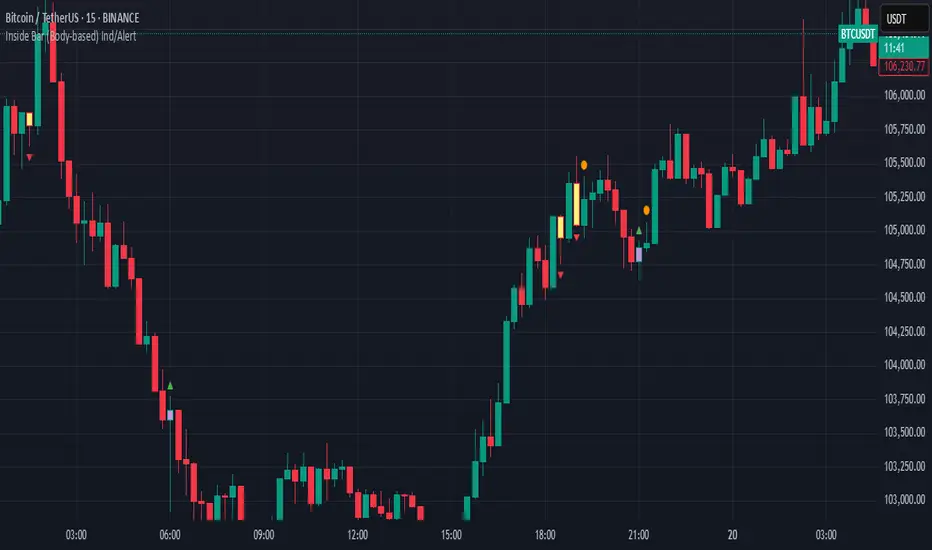
This indicator detects Inside Bar patterns based strictly on the candle body (open/close range) of the mother candle, rather than the traditional high/low wick method. An inside bar is highlighted when the current candle’s entire body is contained within the body of the previous candle.
It can be useful for traders who want a more conservative and reliable definition of inside bars, focusing on true consolidation periods and filtering out signals caused by extended wicks.
Features:
Body-based Inside Bar detection:
The indicator colors and marks candles where the current bar’s body is fully within the previous bar’s body.
Bullish/Bearish identification:
Bullish inside bars are marked in green, bearish in red.
Double Inside Bar Detection:
An optional feature marks when two consecutive candles’ bodies are inside the same mother bar body—potentially indicating stronger consolidation.
Alerts:
Set alerts for single or double inside bars for automated monitoring.
How to Use:
Add the indicator to your chart.
Look for colored bars or plotted shapes for inside bar signals based on candle bodies.
Use alerts to get notified in real time when inside bar patterns appear.
Note:
This script uses only the candle body (open and close) for inside bar calculations, which may help filter out less reliable signals found with wick-based approaches.
4-BAR
Bar Count for XAUThis TradingView indicator labels every other five-minute candle for XAU during the current Beijing session, which runs from 06:00 to 05:00 the next day. It shows the actual bar numbers—1, 3, 5, and so on—only for today’s session; yesterday’s labels are automatically cleared at the new open. The tags appear just below each qualifying candle with no background box, and you can adjust the font size in the settings. In short, it gives you a clean, real-time visual of intraday bar order without clutter

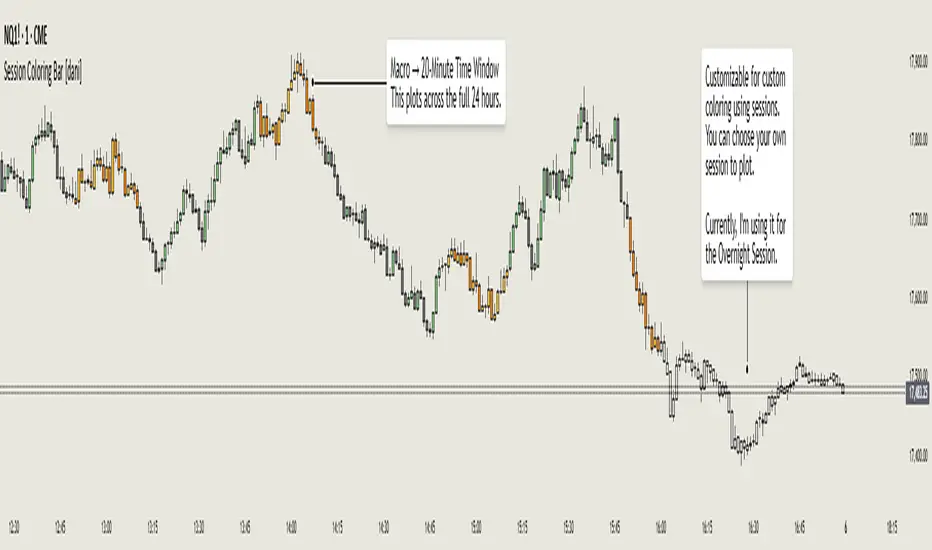
Session Coloring Bar with ICT Macro [dani]The Session Coloring Bar is customizable Pine Script indicator designed to visually enhance your charts by applying unique colors to specific trading sessions or timeframes. This tool allows traders to easily identify and differentiate between macro sessions (e.g., 24-hour cycles) and custom-defined sessions (e.g., Session A, Session B), making it ideal for analyzing market activity during specific periods.
In the context of trading, the term "ICT Macro" , as discussed by Michael J. Huddleston (ICT), refers to specific timeframes or "windows" where market behavior often follows predictable patterns. Traders typically focus on the last 10 minutes of an hour and the first 10 minutes of the next hour (e.g., 0150-0210 , 0050-0110 , or 0950-1010 ) to identify key price movements, liquidity shifts, or market inefficiencies.
This script highlights these macro timeframes, enabling traders to visually analyze price action during these critical periods. Use this tool to support your strategy, but always combine it with your own analysis and risk management.
With this indicator, you can:
Highlight Macro Sessions : Automatically color bars based on predefined 24-hour macro sessions.
Customize Session Settings : Define up to three custom sessions (A & B) with individual start/end times, visibility toggles, and unique bar colors.
Timeframe Filtering : Hide session coloring above a specified timeframe to avoid clutter on higher timeframes.
Personal Notes : Add comments to each session for better organization and quick reference.
Dynamic Color Logic : Bars are colored based on their direction (up, down, or neutral) within the active session.
How to Use:
Enable/Disable Sessions :
Use the Show Coloring toggle to enable or disable session coloring for Macro, Session A, Session B, or Session C.
Set Session Times :
Define the start and end times for each session in the format HHMM-HHMM (e.g., 1600-0930 for an overnight session).
Choose Colors :
Assign unique colors for upward (Bar Up) and downward (Bar Down) bars within each session.
Adjust Timeframe Visibility :
Use the Hide above this TF input to specify the maximum timeframe where session coloring will be visible.
Add Notes :
Use the Comment field to add personal notes or labels for each session.
Example Use Cases:
Overnight Sessions :
Highlight overnight trading hours (e.g., 1600-0930) to analyze price action during low liquidity periods.
Asian/European/US Sessions : Define separate sessions for major trading regions to track regional market behavior.
Macro Analysis : Use the predefined 24-hour macro sessions to study hourly price movements across a full trading day.
Disclaimer:
The Session Coloring Bar is not a trading signal generator and does not predict market direction or provide buy/sell signals. Instead, it is a visualization tool designed to help you identify and analyze specific trading sessions or timeframes on your chart. By highlighting key sessions and their corresponding price movements, this indicator enables you to focus on periods of interest and make more informed trading decisions.
Thank you for choosing this indicator! I hope it becomes a valuable part of your trading toolkit. Remember, trading is a journey, and having the right tools can make all the difference. Whether you're a seasoned trader or just starting out, this indicator is designed to help you stay organized and focused on what matters most—price action. Happy trading, and may your charts be ever in your favor! 😊
BBr1 Candle Range Volitility Gap IndicatorModified Candle Range Volatility Gap Indicator
1. Useful to analyze bars body and wicks and volatility of security.
2. Added a Percentage Option - easier to analyze across different securities.
2. Added a Standard Deviation ("1 std dev= 68.2%, 2 std dev=95.4%, 3 std dev=99.7%, etc") based upon user defined lookback period.
3. Added the ability to include Gaps in Analysis. (Gaps are when the prior closing cost does not equal opening price)
4. Possible Uses setting up stop losses, trailing entries/exits (inside range or outside range).
5. Use it with other indicators in determining if to make an entry or close entry.
Reposted Original Description by © ka66 Kamal Advani
Visually shows the Body Range (open to close) and Candle Range (high to low).
Semi-transparent overlapping area is the full Candle Range, and fully-opaque smaller area is the Body Range. For aesthetics and visual consistency, Candle Range follows the direction of the Body Range, even though technically it's always positive (high - low).
The different plots for each range type also means the UI will allow deselecting one or the other as needed. For example, some strategies may care only about the Body Range, rather than the entire Candle Range, so the latter can be hidden to reduce noise.
Threshold horizontal lines are plotted, so the trader can modify these high and low levels as needed through the user interface. These need to be configured to match the instrument's price range levels for the timeframe. The defaults are pretty arbitrary for +/- 0.0080 (80 pips in a 4-decimal place forex pair). Where a range reaches or exceeds a threshold, it's visually marked as well with a shape at the Body or Candle peak, to assist with quicker visual potential setup scanning, for example, to anticipate a following reversal or continuation.

Lost Bar Locator v1 [Yaphott]Lost Bar Locator v1 helps you locate missing data on your chart.
It does this by looking for consecutive bars that have a delta time greater than the current interval.
Two lines are drawn for each group of one or more missing bars:
Bar before the missing bar(s).
Bar after the missing bar(s).

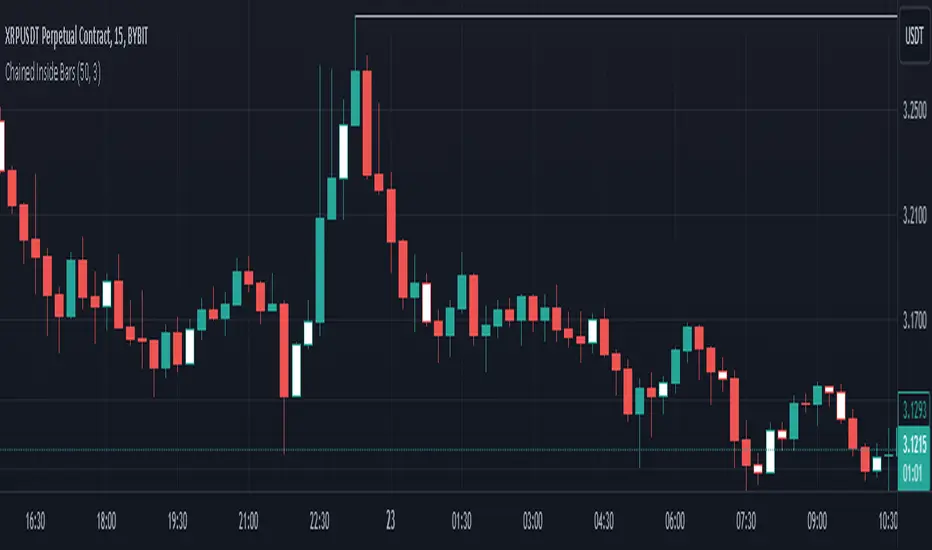
Chained Inside BarsThis script identifies consecutive inside bars by referencing only the most recent non-inside bar, so it avoids excessive lookback. An “inside” bar means its high is lower than the reference bar’s high, and its low is higher than the reference bar’s low. If the current bar is inside, it’s colored white; once price breaks outside, the script updates that new bar as the next reference.
Key Points
• Bars are compared against the last non-inside bar, chaining consecutive inside bars off that same reference bar.
• Inside bars are highlighted in white (non-inside bars retain default chart colors).
• Includes an alert condition for when a new inside bar forms.
• Prevents large dynamic indexing, making it more stable and efficient.
Use this indicator to quickly spot consecutive inside-bar formations without needing to track every single bar-to-bar relationship.
First 5 Minutes Open/Close LinesThis very simple indicator paints lines at the high and low of the first 5m candle of the session. It is primarily intended for big cap NYSE traded stocks with high volume. I wrote this indicator to save me the trouble of manually drawing the lines each day.
The lines drawn at the 5m high/low will remain constant regardless of which timeframe you switch to. In the example screenshot, we are looking at the 1m timeframe. This helps us switch effortlessly between different timeframes to see if a given price movement meets our entry criteria.
In addition to drawing lines at the first 5m high/low, it will optionally paint two zones, one each around the high and low. The boundaries of this zone are configurable and expressed as a percentage of the total movement of the first 5m bar. By default, it is set to 25%.
This indicator is based on the concept that the first 5m bar always has massive volume which helps us infer that price may react around the extremes of that movement. The basic strategy works something like this:
- You identify the high timeframe (HTF) trend direction of the stock
- You wait for the first 5m candle of the session to close
- You wait for price to puncture through the outer boundary of the zone marked by the indicator.
- You enter when price retraces to the high, or low, which marks the midpoint of the punctured zone.
- Only enter long on stocks in a HTF uptrend, and short on stocks in an HTF downtrend.
- Use market structure to identify stop loss and take profit targets
Note: Use at your own risk. This indicator and the strategy described herein are not in any way financial advice, nor does the author of this script make any claims about the effectiveness of this strategy, which may depend highly on the discretion and skill of the trader executing it, among many other factors outside of the author's control. The author of this script accepts no liability, and is not responsible for any trading decisions that you may or may not make as a result of this indicator. You should expect to lose money if using this indicator.

Total Bars CalculatorThis indicator simply plots how much bars are available to the user in the respective chart.
For Example if plot shows 5000 , therefore you have total 5000 bars of OHLC available.

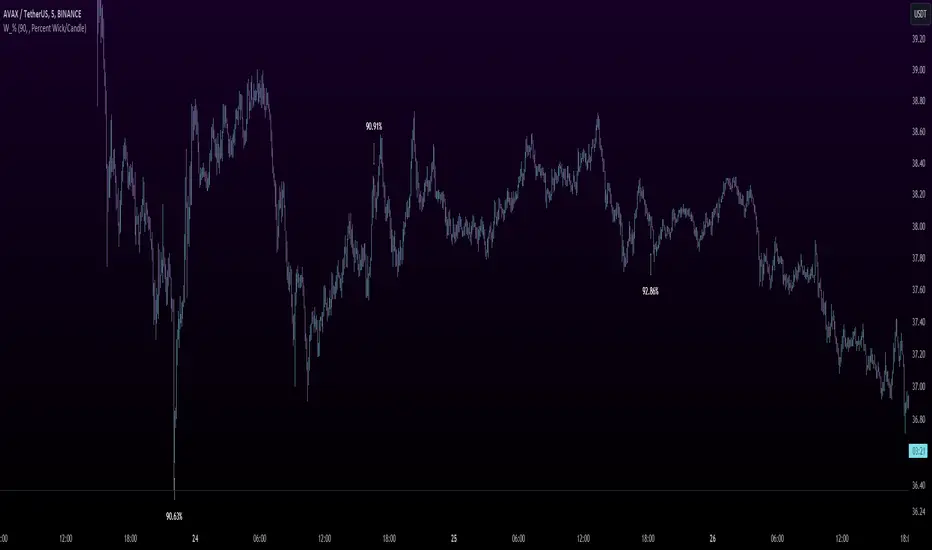
Wick %Heyo Fellas,
thanks for checking out my new indicator.
Introduction
Wick % is a simple indicator to compare wick size with body size (mode 1) and to compare wick size with candle size (mode 2).
Upper wicks are bullish when close is higher than open pricen.
Lower wicks are bearish when close is lower than open price.
Wick Theory
In general, big wick and small bodie on a bar means that bull and bears are fighting heavily.
A big wick below the body means the bulls are leading in that fight,
and a big wick above the body means the bears are leading in that fight.
Calculation Formula
Mode 1 – Percentual Increase Wick/Body:
upperWickPercentage = (upperWick / body) * 100 - 100
lowerWickPercentage = (lowerWick / body) * 100 - 100
Mode 2 – Percent Wick/Candlestick:
upperWickPercentage = (upperWick / (high - low)) * 100
lowerWickPercentage = (lowerWick / (high - low)) * 100
Usage
You can use it on every symbol and every timeframe.
The indicator repaints by default, but you can disable it in the settings.
When you disable repaint, it moves the label one bar to the right.
If you want to use the indicator for signals, you must disable repainting.
Best regards,
simwai
YinYang Bar ForecastOverview:
YinYang Bar Forecast is a prediction indicator. It predicts the movement for High, Low, Open and Close for up to 13 bars into the future. We created this Indicator as we felt the TradingView community could benefit from a bar forecast as there wasn’t any currently available.
Our YinYang Bar Forecast is something we plan on continuously working on to better improve it, but at its current state it is still very useful and decently accurate. It features many calculations to derive what it thinks the future bars will hold. Let’s discuss some of the logic behind it:
Each bar has its High, Low, Open and Close calculated individually for highest accuracy. Within these calculations we first check which bar it is we are calculating and base our span back length that we are getting our data from based on the bar index we are generating. This helps us get a Moving Average for this bar index.
We take this MA and we apply our Custom Volume Filter calculation on it, which is essentially us dividing the current bars volume over the average volume in the last ‘Filtered Length’ (Setting) length. We take this decimal and multiply it on our MA and smooth it out with a VWMA.
We take the new Volume Filtered MA and apply a RSI Filter calculation on it. RSI Filter is where we take the difference between the high and low of this bar and we multiply it with an RSI calculation using our Volume Filtered MA. We take the result of that multiplication and either add or subtract it from the Volume Filtered MA based on if close > open. This makes our RSI Filtered MA.
Next, we do an EMA Strength Calculation which is where we check if close > ema(close, ‘EMA Averaged Length’) (Setting). Based on this condition we assign a multiplier that is applied to our RSI Filtered MA. We divide by how many bars we are predicting and add a bit to each predictive bar so that the further we go into the future the stronger the strength is.
Next we check RSI and RSI MA levels and apply multiplications based on its RSI levels and if it is greater than or less than the MA. Also it is affected by if the RSI is <= 30 and >= 70.
Finally we check the MFI and MFI MA levels and like RSI we apply multiplications based on its MFI levels and if it is greater than or less than the MA. It is also affected by if the MFI is <= 30 and >= 70.
Please note the way we calculate this may change in the future, this is just currently what we deemed works best for forecasting the future bars. Also note this script uses MA calculations out of scope for efficiency but there is potential for inconsistencies.
Innately it’s main use is the projection it provides. It only draws the bars for realtime bars and not historical ones, so the best way to backtest it is with TradingView’s Replay Tool.
Well, enough of the logic behind it, let's get to understanding how to use it:
Tutorial:
So unfortunately we aren’t able to plot legit bars/candles into the future so we’ve had to do a bit of a work around using lines and fills. As you can see here we have 4 Lines and 3 Zones:
Lines:
Green: Represents the High
Orange: Represents the Open
Teal: Represents the Close
Red: Represents the Low
Zones:
High Zone: This zone is from either Open or Close to the High and is ALWAYS filled with Green.
Open/Close Zone: This zone is from the Open to the Close and is filled with either Green or Red based on if it's greater than the previous bar (real or forecasted).
Low Zone: This zone is from either Open or Close to the Low and is ALWAYS filled with Red.
As you can see generally the Forecasted bars are generally within strong pivot locations and are a good estimation of what will likely go on. Please note, the WHOLE structure of the prediction can change based on the current bars movements and the way it affects the calculations.
Let's look 1 bar back from the current bar just so we can see what it used to Forecast:
As you can see it has changed quite a bit from the previous bar, but if you look close, we drew horizontal lines around where its projecting the next bar to be (our current realtime bar), if we go back to the live chart:
Its projections were pretty close for the high and low. Generally, right now at least, it does a much better job at predicting the high and low than it does the open and close, however we will do our best to fine tune that in future updates.
Remember, this indicator is not meant to base your trades on, but rather give you a Forecast towards the general direction of the next few bars. Somewhat like weather, the farther the bar (or day for weather), the harder it is to predict. For this reason we recommend you focusing on the first few bars as they are more accurate, but review the further ones as they may help show the trend and the way that pair will move.
We will conclude this tutorial here, hopefully this Predictive Indicator can be of some help and use to you. If you have any questions, comments, ideas or concerns please let us know.
Settings:
Forecast Length: How many bars should we predict into the Future? Max 13
Each Bar Length Multiplier: For each new Forecast bar, how many more bars are averaged? Min 2
VWMA Averaged Length: All Forecast bars are put into a VWMA, what length should we use?
EMA Averaged Length: All Forecast bars are put into a EMA, what length should we use?
Filtered Length: What length should we use for Filtered Volume and RSI?
EMA Strength Length: What length should we use for the EMA Strength
HAPPY TRADING!

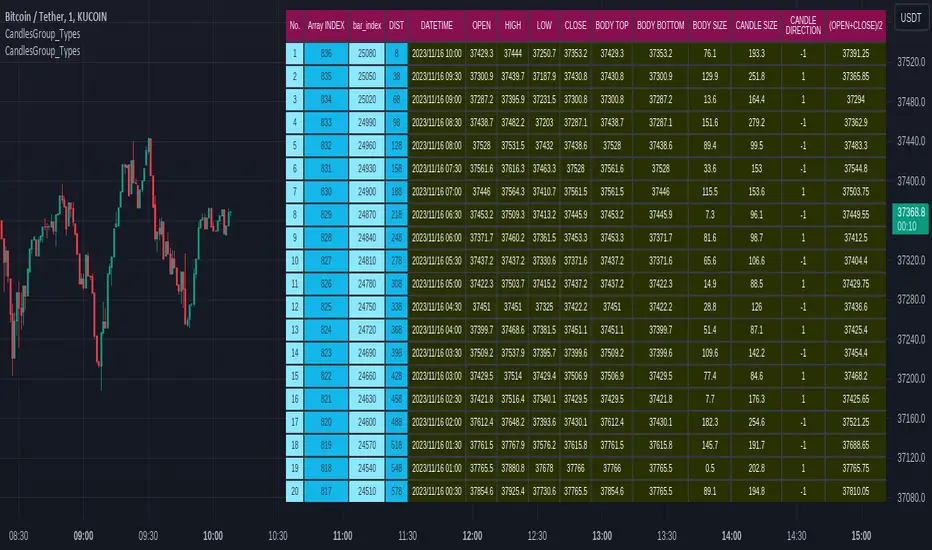
CandlesGroup_TypesLibrary "CandlesGroup_Types"
CandlesGroup Type allows you to efficiently store and access properties of all the candles in your chart.
You can easily manipulate large datasets, work with multiple timeframes, or analyze multiple symbols simultaneously. By encapsulating the properties of each candle within a CandlesGroup object, you gain a convenient and organized way to handle complex candlestick patterns and data.
For usage instructions and detailed examples, please refer to the comments and examples provided in the source code.
method init(_self)
Namespace types: CandlesGroup
Parameters:
_self (CandlesGroup)
method init(_self, propertyNames)
Namespace types: CandlesGroup
Parameters:
_self (CandlesGroup)
propertyNames (string )
method get(_self, key)
get values array from a given property name
Namespace types: CandlesGroup
Parameters:
_self (CandlesGroup) : : CandlesGroup object
key (string) : : key name of selected property. Default is "index"
Returns: values array
method size(_self)
get size of values array. By default it equals to current bar_index
Namespace types: CandlesGroup
Parameters:
_self (CandlesGroup) : : CandlesGroup object
Returns: size of values array
method push(_self, key, value)
push single value to specific property
Namespace types: CandlesGroup
Parameters:
_self (CandlesGroup) : : CandlesGroup object
key (string) : : key name of selected property
value (float) : : property value
Returns: CandlesGroup object
method push(_self, arr)
Namespace types: CandlesGroup
Parameters:
_self (CandlesGroup)
arr (float )
method populate(_self, ohlc)
populate ohlc to CandlesGroup
Namespace types: CandlesGroup
Parameters:
_self (CandlesGroup) : : CandlesGroup object
ohlc (float ) : : array of ohlc
Returns: CandlesGroup object
method populate(_self, values, propertiesNames)
populate values base on given properties Names
Namespace types: CandlesGroup
Parameters:
_self (CandlesGroup) : : CandlesGroup object
values (float ) : : array of property values
propertiesNames (string ) : : an array stores property names. Use as keys to get values
Returns: CandlesGroup object
method populate(_self)
populate values (default setup)
Namespace types: CandlesGroup
Parameters:
_self (CandlesGroup) : : CandlesGroup object
Returns: CandlesGroup object
method lookback(arr, bars_lookback)
get property value on previous candles. For current candle, use *.lookback()
Namespace types: float
Parameters:
arr (float ) : : array of selected property values
bars_lookback (int) : : number of candles lookback. 0 = current candle. Default is 0
Returns: single property value
method highest_within_bars(_self, hiSource, start, end, useIndex)
get the highest property value between specific candles
Namespace types: CandlesGroup
Parameters:
_self (CandlesGroup) : : CandlesGroup object
hiSource (string) : : key name of selected property
start (int) : : start bar for calculation. Default is candles lookback value from current candle. 'index' value is used if 'useIndex' = true
end (int) : : end bar for calculation. Default is candles lookback value from current candle. 'index' value is used if 'useIndex' = true. Default is 0
useIndex (bool) : : use index instead of lookback value. Default = false
Returns: the highest value within candles
method highest_within_bars(_self, returnWithIndex, hiSource, start, end, useIndex)
get the highest property value and bar index between specific candles
Namespace types: CandlesGroup
Parameters:
_self (CandlesGroup) : : CandlesGroup object
returnWithIndex (bool) : : the function only applicable when it is true
hiSource (string) : : key name of selected property
start (int) : : start bar for calculation. Default is candles lookback value from current candle. 'index' value is used if 'useIndex' = true
end (int) : : end bar for calculation. Default is candles lookback value from current candle. 'index' value is used if 'useIndex' = true. Default is 0
useIndex (bool) : : use index instead of lookback value. Default = false
Returns:
method highest_point_within_bars(_self, hiSource, start, end, useIndex)
get a Point object which contains highest property value between specific candles
Namespace types: CandlesGroup
Parameters:
_self (CandlesGroup) : : CandlesGroup object
hiSource (string) : : key name of selected property
start (int) : : start bar for calculation. Default is candles lookback value from current candle. 'index' value is used if 'useIndex' = true
end (int) : : end bar for calculation. Default is candles lookback value from current candle. 'index' value is used if 'useIndex' = true. Default is 0
useIndex (bool) : : use index instead of lookback value. Default = false
Returns: Point object contains highest property value
method lowest_within_bars(_self, loSource, start, end, useIndex)
get the lowest property value between specific candles
Namespace types: CandlesGroup
Parameters:
_self (CandlesGroup) : : CandlesGroup object
loSource (string) : : key name of selected property
start (int) : : start bar for calculation. Default is candles lookback value from current candle. 'index' value is used if 'useIndex' = true
end (int) : : end bar for calculation. Default is candles lookback value from current candle. 'index' value is used if 'useIndex' = true. Default is 0
useIndex (bool) : : use index instead of lookback value. Default = false
Returns: the lowest value within candles
method lowest_within_bars(_self, returnWithIndex, loSource, start, end, useIndex)
get the lowest property value and bar index between specific candles
Namespace types: CandlesGroup
Parameters:
_self (CandlesGroup) : : CandlesGroup object
returnWithIndex (bool) : : the function only applicable when it is true
loSource (string) : : key name of selected property
start (int) : : start bar for calculation. Default is candles lookback value from current candle. 'index' value is used if 'useIndex' = true
end (int) : : end bar for calculation. Default is candles lookback value from current candle. 'index' value is used if 'useIndex' = true. Default is 0
useIndex (bool) : : use index instead of lookback value. Default = false
Returns:
method lowest_point_within_bars(_self, loSource, start, end, useIndex)
get a Point object which contains lowest property value between specific candles
Namespace types: CandlesGroup
Parameters:
_self (CandlesGroup) : : CandlesGroup object
loSource (string) : : key name of selected property
start (int) : : start bar for calculation. Default is candles lookback value from current candle. 'index' value is used if 'useIndex' = true
end (int) : : end bar for calculation. Default is candles lookback value from current candle. 'index' value is used if 'useIndex' = true. Default is 0
useIndex (bool) : : use index instead of lookback value. Default = false
Returns: Point object contains lowest property value
method time2bar(_self, t)
Convert UNIX time to bar index of active chart
Namespace types: CandlesGroup
Parameters:
_self (CandlesGroup) : : CandlesGroup object
t (int) : : UNIX time
Returns: bar index
method time2bar(_self, timezone, YYYY, MMM, DD, hh, mm, ss)
Convert timestamp to bar index of active chart. User defined timezone required
Namespace types: CandlesGroup
Parameters:
_self (CandlesGroup) : : CandlesGroup object
timezone (string) : : User defined timezone
YYYY (int) : : Year
MMM (int) : : Month
DD (int) : : Day
hh (int) : : Hour. Default is 0
mm (int) : : Minute. Default is 0
ss (int) : : Second. Default is 0
Returns: bar index
method time2bar(_self, YYYY, MMM, DD, hh, mm, ss)
Convert timestamp to bar index of active chart
Namespace types: CandlesGroup
Parameters:
_self (CandlesGroup) : : CandlesGroup object
YYYY (int) : : Year
MMM (int) : : Month
DD (int) : : Day
hh (int) : : Hour. Default is 0
mm (int) : : Minute. Default is 0
ss (int) : : Second. Default is 0
Returns: bar index
method get_prop_from_time(_self, key, t)
get single property value from UNIX time
Namespace types: CandlesGroup
Parameters:
_self (CandlesGroup) : : CandlesGroup object
key (string) : : key name of selected property
t (int) : : UNIX time
Returns: single property value
method get_prop_from_time(_self, key, timezone, YYYY, MMM, DD, hh, mm, ss)
get single property value from timestamp. User defined timezone required
Namespace types: CandlesGroup
Parameters:
_self (CandlesGroup) : : CandlesGroup object
key (string) : : key name of selected property
timezone (string) : : User defined timezone
YYYY (int) : : Year
MMM (int) : : Month
DD (int) : : Day
hh (int) : : Hour. Default is 0
mm (int) : : Minute. Default is 0
ss (int) : : Second. Default is 0
Returns: single property value
method get_prop_from_time(_self, key, YYYY, MMM, DD, hh, mm, ss)
get single property value from timestamp
Namespace types: CandlesGroup
Parameters:
_self (CandlesGroup) : : CandlesGroup object
key (string) : : key name of selected property
YYYY (int) : : Year
MMM (int) : : Month
DD (int) : : Day
hh (int) : : Hour. Default is 0
mm (int) : : Minute. Default is 0
ss (int) : : Second. Default is 0
Returns: single property value
method bar2time(_self, index)
Convert bar index of active chart to UNIX time
Namespace types: CandlesGroup
Parameters:
_self (CandlesGroup) : : CandlesGroup object
index (int) : : bar index
Returns: UNIX time
Point
A point on chart
Fields:
price (series float) : : price value
bar (series int) : : bar index
bartime (series int) : : time in UNIX format of bar
Property
Property object which contains values of all candles
Fields:
name (series string) : : name of property
values (float ) : : an array stores values of all candles. Size of array = bar_index
CandlesGroup
Candles Group object which contains properties of all candles
Fields:
propertyNames (string ) : : an array stores property names. Use as keys to get values
properties (Property ) : : array of Property objects
[DIP] Inverse BB/Bollinger highlight for barsThis indicator allows you to highlight the area outside of the Bollinger Bands in order to draw more attention to it. This is especially useful for those who only trade when we are outside of the bands.
Keep in mind this indicator only works on bars, not on candles.

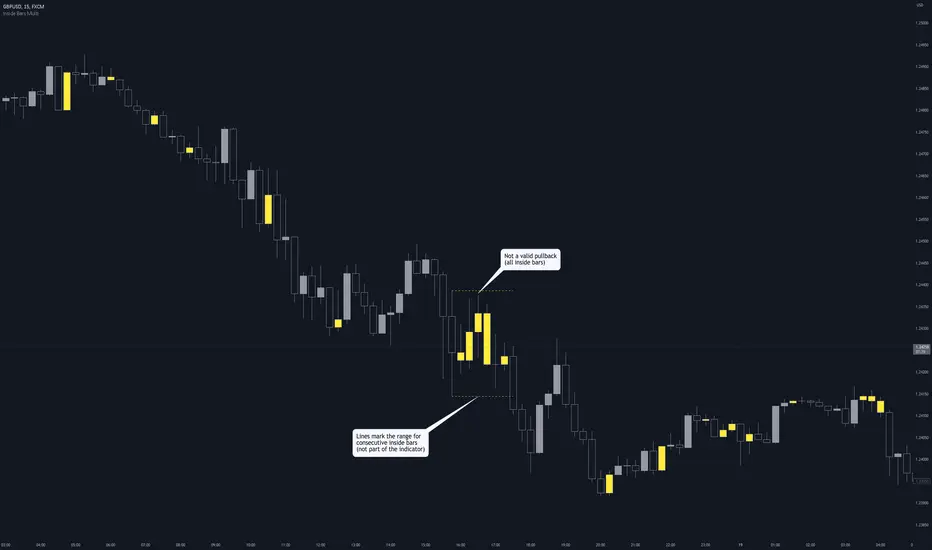
Inside Bars (Multiple / Consecutive)Description
When an inside bar is found, the indicator remembers the high and low (= range) of the candle before the inside bar.
As long as price moves within the range, every bar is highlighted as an inside bar to the range.
Purpose
The indicator can assist when identifying valid pullbacks and buy-side liquidity (BSL) / sell-side liquidity (SSL).
shadow barThis indicator shows a new formation of retrospective candlestick bars of one period (n) of time.
In this way the trader can see how the traditional bars are part of a larger formation that can show a trend or a range.
The new shadow bars are drawn with a degree of transparency that makes it possible to distinguish traditional candlesticks;
and where shadow candles can be seen as support or resistance to traditional candlesticks.
When the traditional candlesticks are the same size as the shadow candlesticks, it can be expected that we are forming a compression or range that will result in a strong move.
In addition to the shadow bars, there is a ribbon created from the new candlestick data that is formed as a line from the linear regression function and another that is the previous line smoothed by its exponential moving average. This tape allows you to see the trend more clearly and at the crossovers of the lines that form possible reversals or continuations of the trend. The indicator has the timeframe field active, which allows the indicator to be displayed in other temporalities.
*The closing price of the new bars is the same as that of the traditional bars.
* The tape is turned off by defa

RSI Candle Advanced V2RSI Advanced
As the period value is longer than 14, the RSI value sticks to the value of 50 and becomes useless.
Also, when the period value is less than 14, it moves excessively, so it is difficult for us to see the movement of the RSI .
So, using the period value and the RSI value as variables, I tried to make it easier to identify the RSI value through a new function expression.
This is how RSI Advanced was developed.
Period below 14 reduce the volatility of RSI , and period above 14 increase the volatility of RSI, allowing overbought and oversold zones to work properly and give you a better view of the trend.
By applying the custom algorithm so that the 'RSI Advanced' with period on a 5-minute timeframe has the same value as the 'original RSI' with period on a 60-minute timeframe.
As another example, an 'RSI Advanced' with a period in a 60-minute time frame has the same value as an 'original RSI' with a period in a 240-minute time frame.
Compare the difference in the RSI with a period value of 200 in the snapshot.
------------------------------------------------------------------------------------------
RSI Candlestick
RSI derives its value using only the closing price as a variable.
I solved the RSI equation in reverse and tried to include the high and low prices of candlesticks in the equation.
As a result, 'if the high or low was the closing price, the value of RSI would be like this' was implemented.
Just like when a candle comes down after setting a high price, an upper tail is formed when RSI Candle goes down after setting a high price!!
In divergence, we had to look only at the relationship between closing prices, but if we use RSI candles, we can find divergences in highs and highs, and lows and lows.
Existing indicators could not express "gap", but Version 2 made it possible to express "gap"!!!!!!
RSI can be displayed as candlesticks, bars and lines
Then enjoy my RSI!
----------------------------------------------------------------------------------------
RSI Advanced
기간값이 14보다 길어질수록 RSI값은 50값에 달라붙게 되어서 쓸모가 없어집니다.
또 기간값이 14보다 줄어들수록 과도하게 움직여서 우리는 RSI의 움직임을 보기가 힘듭니다.
그래서 기간 값과 RSI 값을 변수로 사용하여 새로운 함수 식을 통해 RSI 값을 식별하기 편하도록 해보았습니다.
이렇게 RSI Advanced가 개발되었습니다.
기간값이 14보다 낮으면 rsi의 변동폭이 줄어들고, 기간값이 14보다 크면 변동폭이 넓어져 과매수 및 과매도 영역이 제대로 작동하여 추세를 더 잘 볼 수 있습니다.
또한 저는 5분 타임프레임의 기간값이 168(=14*12)인 RSI가 주기 값이 14인 60분 타임프레임의 RSI와 동일한 값을 갖도록 적절한 함수 표현식을 적용하여 RSI를 변경했습니다.
다른 예로, 15분 시간 프레임에서 기간값이 56(=14*4)인 RSI는 60분 시간 프레임의 기간값이 14인 RSI와 동일한 값을 갖습니다.
기간값이 200인 RSI의 차이를 스냅샷에서 비교해보십시오.
-----------------------------
RSI Candlestick
RSI는 종가만을 변수로 사용하여 값을 도출해냅니다.
저는 RSI 식을 역으로 풀어내어서 캔들스틱의 고가와 저가, 시가를 식에 포함시켜보았습니다.
결과적으로, '만약 고가나 저가가 종가였다면 RSI의 값이 이럴것이다'를 구현해내었습니다.
캔들이 고가를 찍고 내려오면 윗꼬리가 생기듯 RSI Candle에서도 고가를 찍고 내려오면 윗꼬리가 생기는겁니다!!
다이버전스 또한 원래는 종가끼리의 관계만 봐야했지만 RSI 캔들을 이용한다면 고가와 고가, 저가와 저가에서도 다이버전스를 발견할 수 있습니다.
기존의 지표는 "갭"을 표현하지 못했지만 Version 2 에서는 "갭"을 표현할 수 있게 만들었습니다!!!!!!
그럼 잘 사용해주십시오!!!

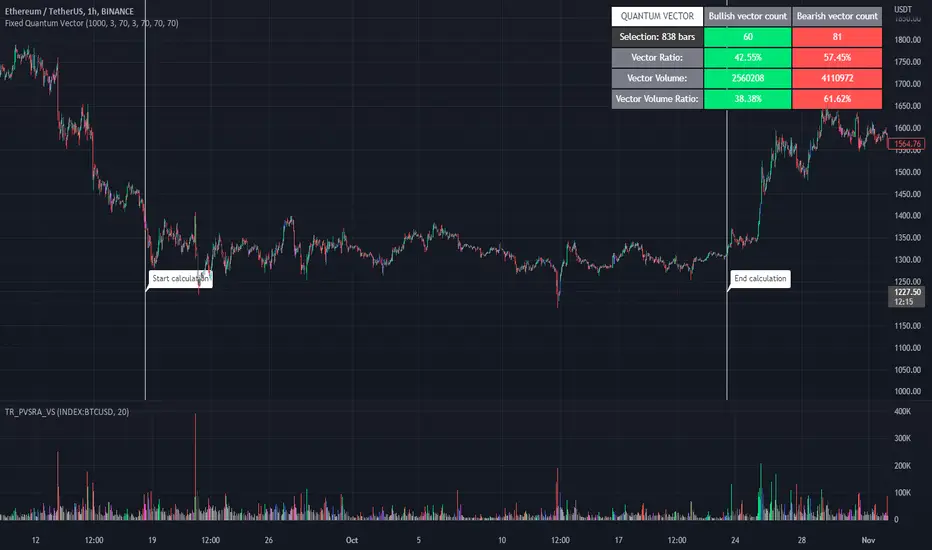
Fixed Quantum VectorSelect a zone to analyse the vectors.
This screener show the ratio of the bullish and bearish candle vector and on volume.
Slide the white bar to choose your sample size or you can enter the date.
Click label to hide start calculation and end calculation.
- Happy trading
Volume ChartVolume data can be interpreted in many different ways. This is a very basic script and novel idea to display volume as a chart. The purpose of this script is to visually help identify volume breakouts and other common chart patterns. While this indicator could be useful for finding big moves and early reversals it not reliable for determining the direction of the move.
Below is an example of a volume breakout:
Below is confirmation of the second ear in the batman pattern:
Lower highs and higher lows can give early signs of a reversal:
Below we can see retailers getting pumped and dumped on during the gaps while they sleep:

Abnormal bar % v.1This script helps you find abnormal bars on the charts.
An abnormal bar is a bar that is larger than the adjacent bar by at least 50 percent.
The script can search for bars on any time frame.
The search for an abnormal bar, is possible in two ways:
- on the absolute value, for example - all that is higher than 0.5% is considered an abnormal bar, on different timeframes it is necessary to change the percentage values;
- on the basis of the ATR, in my opinion it is a more objective result.
In the settings available:
- choice of color to display percentages on the screen;
- choice of calculation method;
- Selecting the value - what is considered an abnormal bar.
======
Данный скрипт помогает найти на графиках аномальные бары.
Аномальный бар - это бар который, больше рядом стоящего бара как минимум на 50 процентов.
Скрипт может искать бары на любом тайм-фрейма.
Поиск аномального бара, возможен в двух вариантах:
- по абсолютному значению, например - всё что выше 0.5%, считается аномальным баром, на разных тайм-фреймах нужно менять значения процентов;
- на основание ATR, на мой взгляд это более объективный результат.
В настройках доступно:
- выбор цвета для отображения процентов на экране;
- выбор способа поиска;
- выбор значения - что считаем аномальным баром.
==

Strategy Myth-Busting #10 - InsideBar+EMA - [MYN]This is part of a new series we are calling "Strategy Myth-Busting" where we take open public manual trading strategies and automate them. The goal is to not only validate the authenticity of the claims but to provide an automated version for traders who wish to trade autonomously.
Our 10th one we are automating is the " 75% Win Rate High Profit Inside Bar Trading Strategy - What If You ... " strategy from " Trade Pro " who claims to have backtested this manually and achieved 11,063% profit with a 75% winrate over 100 trades. I was unable to emulate these results consistently accommodating for slippage and commission but even so, the results look promising. I was only able to achieve this win-rate with some multiple take profit staggering. Even so the markdown is above where I would normally consider comfortable (>20%).
If you know of or have a strategy you want to see myth-busted or just have an idea for one, please feel free to message me.
This strategy uses a combination of 2 open-source public indicators:
Inside Bar Ind/Alert by CMA
EMA (built-in)
Trading Rules
4 hour candles
Stop Loss at EMA Line with TP Target 1.5x the risk
Long Entry when these conditions are true
inside bar and bullish
Bar close's above 50 ema
Price action rises above high of inside bar .
Short Entry when these conditions are true
inside bar and bearish
Bar close below 50 ema
Price action falls below low of inside bar

[SS]Multicolor BB with Squeez Moving Average & Colored BarsHello Followers,
Hope u guyz doing well in the market.
Came with a standalone Trading System which helps u with the trend & choppiness zone.
This system is combination of multiple stretagies which makes it better than single published indicators.
=========================================================================================================
We have used Variety-Filtered, Squeeze Moving Averages which is a chop zone indicator that identifies when price is below a specific volatility threshold calculated as the difference between a fast and slow moving average and filtered using ATR- or Pips-based threshold. This indicator can be use as both an entry and exit indicator. It identifies both chop zones and breakouts/breakdowns
Uses:-
When the candles turn white and the threshold bands appear on the chart, this is indicative of low volatility
When price exits the threshold bands, price will usually explode up or down giving a long or short signal. This acts as a sort of squeeze momentum.
Included:
Bar coloring
Signals
Alerts, 4 types of alerts: Squeeze started, Squeeze ended, long, and short
<<------------------------------------->>
Multicolour Bollinger Bands indicator that indicates market phases.
It plots on the price chart, thanks to different color zones between the bands, a breakdown of the different phases that the price operates during a trend.
The different zones are identified as follows:
- red color zone: trend is bearish , price is below the 200 periods moving average
--> orange color zone: price operate a technical rebound below the 200 periods moving average
- yellow color zone: (phase 1 which indicate a new bearish cycle)
- light green zone: (phase 2 which indicate a new bullish cycle)
--> dark green zone: trend is bullish , price is above the 200 periods moving average
- grey color zone: calm phase of price/low volatility
- dark blue color zone: price is consolidating in either bullish or bearish trend
- light blue zones: price will revert to a new opposite trend (either long or short new trend)
By identifying clearly the different market phases with the multicolor Bollinger bands , the market entries by either a the beginning of a new trend or just after a rebound or a consolidating phase is easier to spot on.
<<==========================>>
The credit of above indicator souce goes to loxx & Deveatt. I just backtested and modified it to increase accuracy of trade and clear visual representation for trades.
Modified the trend based SMA and BB period and entry criteria.
<<===========================>>
<>
1) Look for BB COLOR and SMA for trend either up or down.
2) Look Bar coloring, enter when price above sma and green for long else short.

Chervolinos_Rob Hoffman_Inventory Retracement Bar_and_OverlayHere is something like a combo from the well known Rob Hoffman (Overlay) Indicator and the Inventory Retracement Bar without any ballast
This really smart strategy with a low risk and a quick profit. I combine this two Indicators to save space.
The first condition is that the orange line and the lime line must be parallel and there is no other line between them because this condition is moving under 45 angle.
The second condition is that the target candles must be below the orange line in the case of the downtrend as we see.
As we see it here in the case of an uptrend should be candles above the orange line and this is logical as we see here.
Sometimes we noticed the appearance of the signal onto the candle but the conditions were not applicable because there is an orange line between the green line and the orange line and this means that the signal is fake.
This candle is also good for entry and we can place a buy order above it but is it beginner, so you must respect the conditions in order to be able to master it very well.
Enter with Confidence all conditions are present a red arrow above the candle and the candle is above the orange line and there are no lines between the lime and
orange line. Yes this is our target the entry-point will be a little above the wicked the candle, that is you will not buy now but it's a price exceeds the weight limit
even slightly, we will buy directly it is hoffman's method. Expected if the price in which resistance occurred which is the resistance represented
by the candlewick will be broken the price for rise up and strongly and if it does not happen you will not lose anything anyway to stop loss and take profit. Try the ratio by 1,5.
This part of this strategy is one of the best trading strategies with a low risk rate and can be used as an initial guide to know the market movement and to enter successful trades.
Let's start correctly. This strategy can be used on any time frame from one minute to one day or even more, but I recommend using it on a 10-minute frame one hour or 30 minutes frame. Here I use the 30-Minute frame.
This strategy is based on two things: Tramp Direction and the inventory retracement bar. Don't worry and don't think about it because all this will be automatic but let's understand some simple terms.
There many arrows in green and red. Please read the discription above.
Please read the following tipps:
To avoid the trend Reversal, try to add one one of the Divergence indicators to your chart.
To avoid entering in a pullback movement as much as possible.
--> Combine it with other indicators <--
Best Regards Chervolino
if there were any typographical errors, please forgive me
Note: Buy/Sell signals using non-standard chart types (Heikin Ashi, Renko, Kagi, Point & Figure, and Range) are not allowed, as they produce unrealistic results

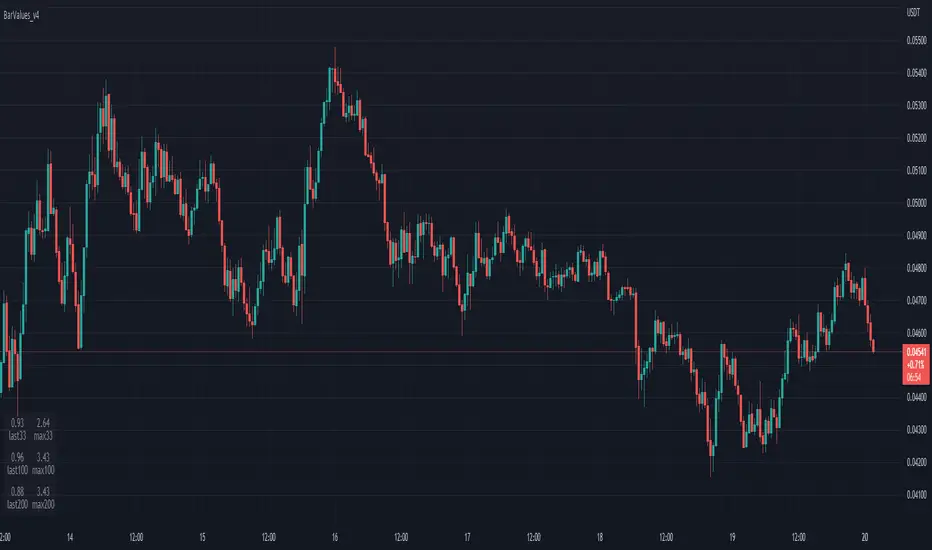
TableBarValues_v4It give you the absolute value of bar changes for different period of tims (33, 100, 200) AND the max barchange ont the same period.
Can be added in v4 in all codes. Stupid but useful.
You can add it to any v4 script. The location of the table can be changed easily
Inspired from the tradingview community. Don't forget to hydrate. @Magnumm
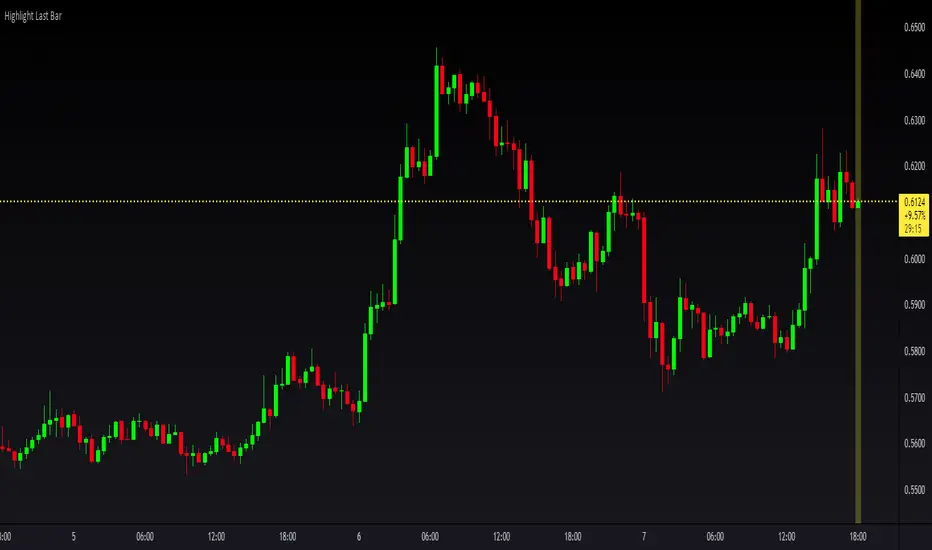
Highlight last bar, work on all timeframe, v4 & v5 @magnummHighlight last bar only. No refresh needed.
Works on all time frame and for version 4 & 5.
Can be added in your own scripts copy/pasting just one line.
//DON'T FORGET TO HYDRATE