Volume Extension [DepthHouse]DepthHouse Volume Extension uses average calculations to determine the dynamic range which the volume travels through. Any spike above the line represents an over extension in average volume.
The colored bars are then calculated in a similar way, which measures a combination of both price and volume action to determine bull & bear exhaustion levels, and possible entry/exit points for big players.
This indicator is 100% free , so if you benefit from using it, please consider supporting me by checking out the several other indicators available on my page :)
Accumulation-distribution

Ichimoku A/D Breakoutthis is basically a clone of the super a/d indicator but we're using a standard ichimoku as the source for the trend instead of the supertrend indicator

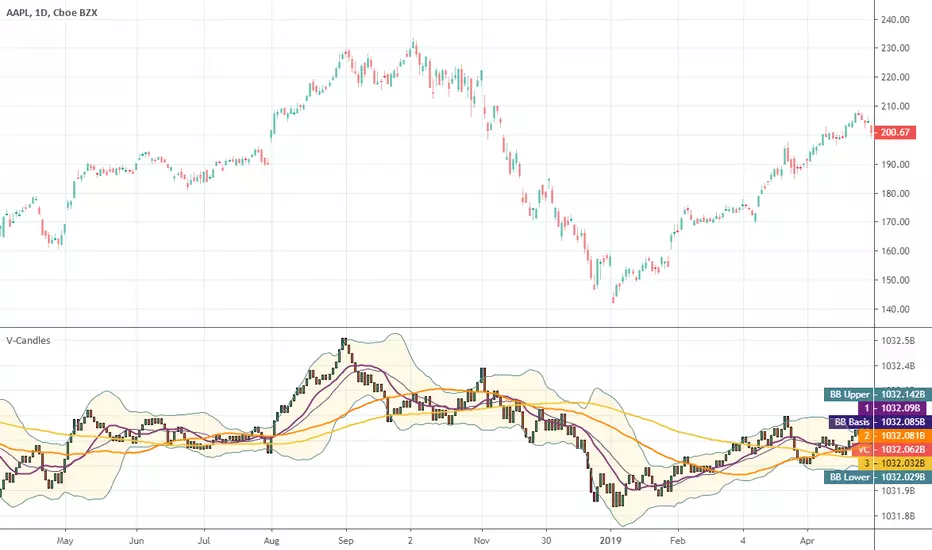
Volume CandlesHello traders!
Well, I was trying to implement EquiVolume Charts that were developed by Richard W. Arms, but unfortunately I got a poor result.
Instead, I used my groundwork on EquiVolumes to create Volume Candles indicator to help you make better, smarter trades.
What are the cool features?
Excellently filters the instrument's movements
Gives a better view of the accumulation/distribution phases
Completely removes price gaps
Works on ANY instrument that has available volume data.
Personally, I am a big fan of the volume-based indicators and to clarify my position I cite the following words of Buff Pelz Dormeier from his book "Investing with Volume Analysis: Identify, Follow, and Profit from Trends" :
A trade produces only two pieces of information: the price and price's neglected sibling, volume. Perhaps the least appreciated piece of the puzzle, volume represents fertile ground for technical analysis. Proficiency in volume analysis is a rare skill. Properly understood, though, volume analysis can provide its practitioner with the power to peer deeply into market mechanics.
Benjamin Graham, the father of value investing and a mentor of Warren Buffett, often called the market a 'voting machine'. If so, then volume is the ballot box. Volume is a literal illustration of the power behind the forces of supply and demand.
Volume is understood as the validation of price, the source of liquidity, the substantiation of information, the fulfillment of convictions, the revelation of divergent opinions, the fuel of the market, the proponent of truth, and the energy behind the velocity of money. If you believe any of this information might be important in making an investment decision, volume analysis is important to you.
I attached some screenshots to show you how it works with other instruments.
Happy Trading!

Ultimate Money Flow (UMF), Stoch, Multi Time Frame (MTF) [cI8DH]This indicator adds stochastic, multi time frame, signal line, histogram, and bar coloring options to my previous indicators. It can also replicate standard Money Flow Index ( MFI ), Chaikin's Accumulation/Distribution Line ( ADL ), On Balance Volume ( OBV ) and Price-Volume Trend ( PVT ). This indicator can be used for analyzing momentum, buy/sell pressure, overbought/oversold conditions, and trendiness/choppiness, as well as identifying swings (stoch). Chart below shows example multi-TF setup with bar coloring.
For analyzing price, I made a similar indicator based on Absolute and Relative Strength Indices, which you can find in the link below.
Equation
Here is part of the code used in the script: pastebin.com
Standard MFI, OBV, ADL and PVT
To validate the calculations, I stacked UMF on MFI, OBV, ADL, and PVT in the chart below (100% overlaps validate the calculations). It also shows how you can replicate these indicator if you'd like to use them, or if you want to make your own custom indicator by combining features from different indicators. I do not recommend MFI, ADL or OBV; read "why invent a new indicator" section below. (bear in mind that MFI scale is 0-100, while UMF scales is -100 to 100)
Money Flow based on "Balance of Power" (this is the default mode)
Balance of Power (BoP) equation is: (close - open) / (high - low)
In my opinion, BoP is the most accurate equation to measure the amount of volume accumulated or distributed. I used BoP in my previous open source indicators ADV , ADL , ADP and ADMF . I applied the "True Range" fix to BoP equation similar to what Twiggs did on CMF .
Aggregation Method
By changing aggregation methods, you can replicate my previous indicators which are also linked at the bottom of this page. Please read more about their applications in their respective pages.
aggregation method = Cumulative => ADL indicator: accumulation/distribution (price factoring should be turned off)
aggregation method = MA => ADMF indicator: accurate buy/sell pressure, momentum and divergence
aggregation method = MA Percent => ADP indicator: overbought/oversold conditions, buy/sell pressure, momentum and divergence, failure swings
Smoothing, signal line and histogram to detect trend and choppiness
You can apply additional smoothing to UMF. Also, you can add a signal line and histogram (histogram is the difference between main line and signal line). To do so, set the signal length to a number greater than one. Signal line can help you detect changes in trend similar to the signal line on MACD. If signal line criss-crosses UMF, it shows market is choppy. The worst case is when this criss-crossing coincides with UMF flattening near neutral line and histogram height is short; that means market is ded (until it is not; expansion following a contraction period is a common phenomena)! (Bear in mind that histogram will not show in stoch mode.)
Stochastic
To enable stoch, change the stoch length to a number greater than 1 (default stoch length for the built-in stoch RSI is 14). This length should be calibrated depending on TF and asset. If done correctly, it can be a powerful tool for identifying swings. Stoch can be combined with any aggregation method. I recommend using stoch with MA or cumulative aggregation methods. For conventional uses of stochastic, please read www.tradingview.com(STOCH) and www.tradingview.com(STOCH_RSI).
Experimental Bar coloring Feature
There is an option to color bars depending on UMF's position relative to the signal line. If both TFs are used in coloring and they are in disagreement, the TF with greater histogram height wins. There are two shades of green and red. The darker shade means both TFs agree. If you use the signal line, bar coloring can help with calibrating the indicator (play with parameters until you see a good looking chart i.e. a lot of green candles followed by a lot of red candles in a row). Please note that bar colors might change until candle(s) close(s). The bar coloring rules will most likely change in the future.
Notes
- Uncheck "Factor Price" for Bitmex or any other exchange that shows volume in terms of money.
- UMF is a replacement to ADP , ADMF and ADL , so no more updates for the old indicators!
- Smooth MA length N = EMA length 2*N-1
- Combined tickers, e.g. (COINBASE:BTCUSD+BITSTAMP:BTCUSD+KRAKEN:XBTUSD)/3, can mitigate inconsistency issues between different exchanges (I recommend not mixing USD and USDT pairs together)
Why invent a new indicator
I have spent a great deal of time to find the best equation that represents accumulation/distribution. Each of the well-known methods have a major flaw.
- Winner-take-all problem
MFI, OBV and to some extent Williams AD assign accumulation or distribution based on the direction of change in price. They don't account for the amount of change. That means the indicator does not differentiate between a full candle and a doji candle.
- Extreme divergence problem
Chaikin tried to avoid winner-take-all problem. However, he ended up with a solution that, in my opinion, is even worse. A big flaw of Chaikin's indicators is that they can diverge too much from price. Most responsive indicators in this class, require at least two candles to diverge from price, but CMF/ADL can diverge in a single candle. Chaikin used the same component ( aka Chaikin's money flow multiplier) in both CMF and ADL. CMF 's flaws may not be as visible because it is a normalized oscillator. However, this common flaw is more evident in accum/dist indicator which keeps all past information in its memory. As you can see in the chart below, accum/dist is constantly rising during an obviously distribution period.
ADV (Volume)
ADP
ADMF
ADL
Please give a like, and share the interesting configurations you find in the comments.

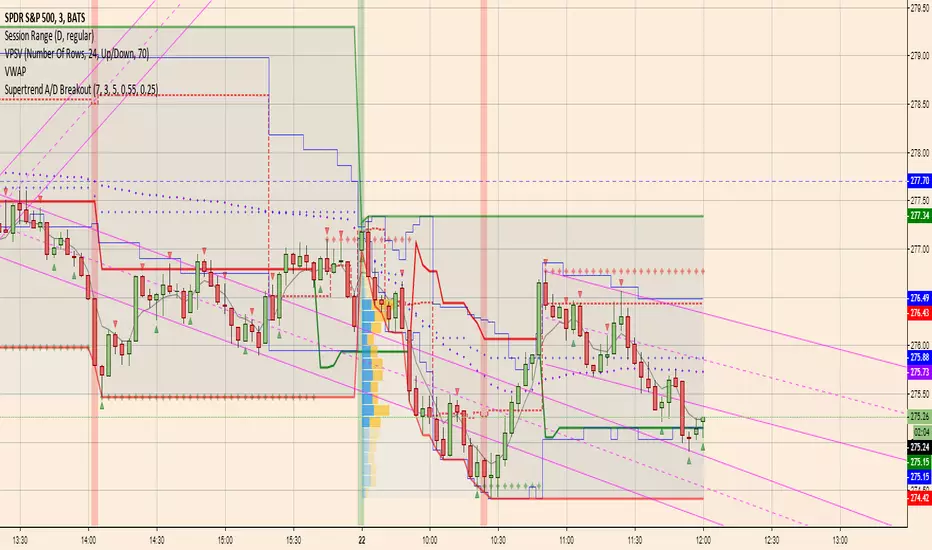
Supertrend A/D BreakoutModified Hoffman A/D:
1. uses standard supertrend to determine up/down direction (previous version used ema crossover)
2. uses improved A/D candlestick patterns
I'm optimistic about this one
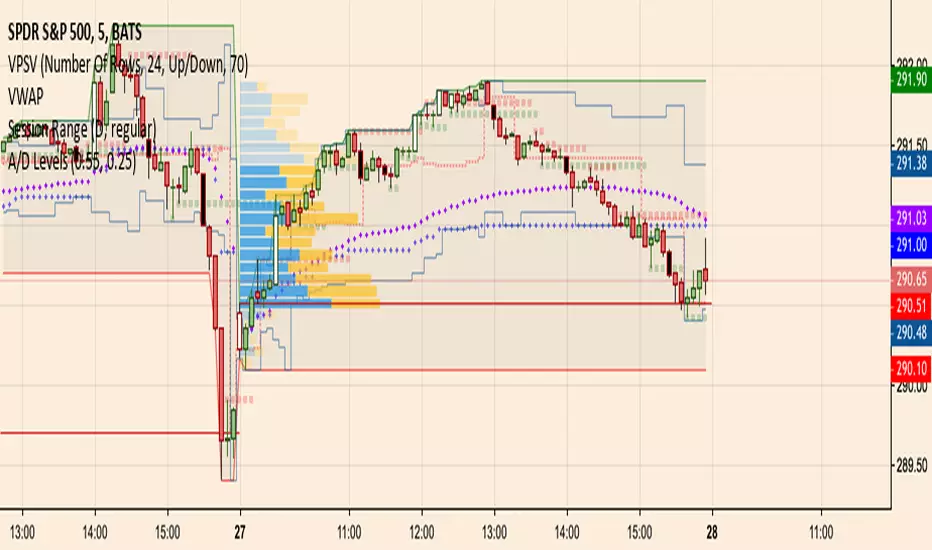
A/D Levelsuses reversal candles to determine accumulation and distribution candles
remembers the last reversal candle and draws a support or resistance line at the reversal level
does a barcolor if the price breaks support/resistance
similar to the hoffman a/d breakout indicator but there is no trend detection components
Hoffman A/D BreakoutStudy based on Rob Hoffman's Accumulation/Distribution Breakout strategy.
- Green circle on the top wick indicates a "Distribution" wick
- Red circle on the bottom wick indicates an "Accumulation" wick
- A distribution wick in an uptrend gets marked as a Key Resistance. This is marked with green crosses
- An Accumulation wick in a downtrend gets marked as a Key Support. This is marked with red crosses
- Breaking above the Key Resistance indicates a buy entry. This is marked by a green background.
- Breaking below the Key Support indicates a sell entry. This is marked by a red background

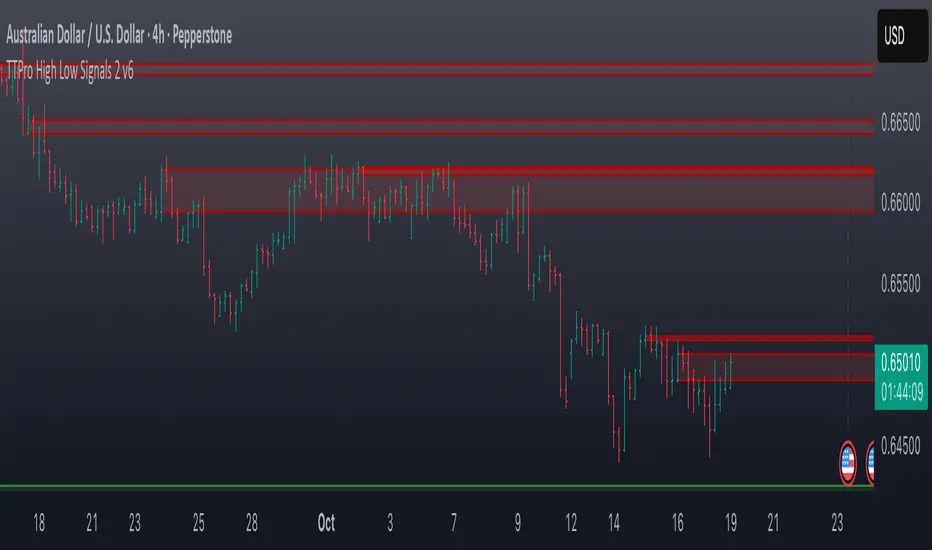
TTPro High Low Signals 2 v6TTPro High Low Signals 2 v6 is a leading indicator that can identify trends, anticipating trend reversals and highlight overbought and oversold levels. It is also useful in identifying bullish and bearish divergences and detecting early momentum shifts. Visit www.turbotraderpro.com for more details.
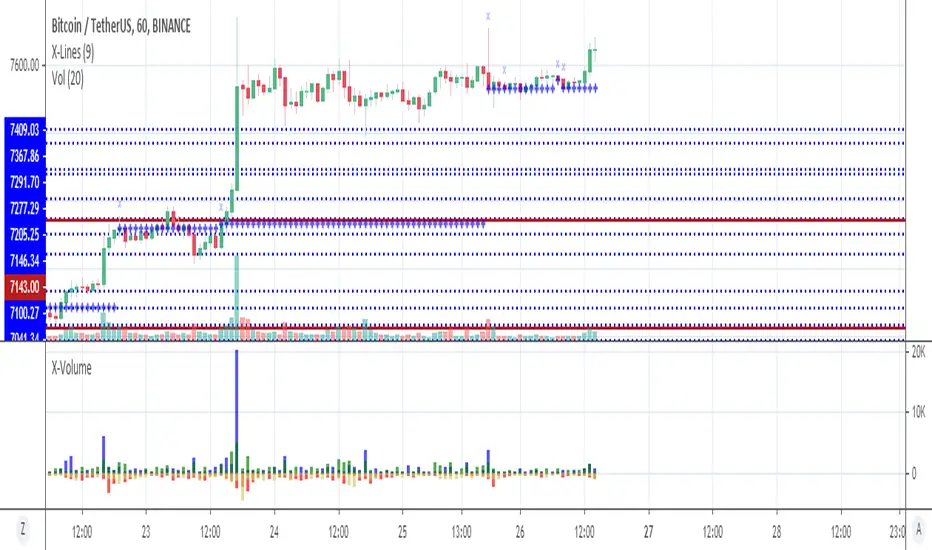
X-VolumeUsing the indicator, you can roughly analyze the accumulation and distribution of trading volume.