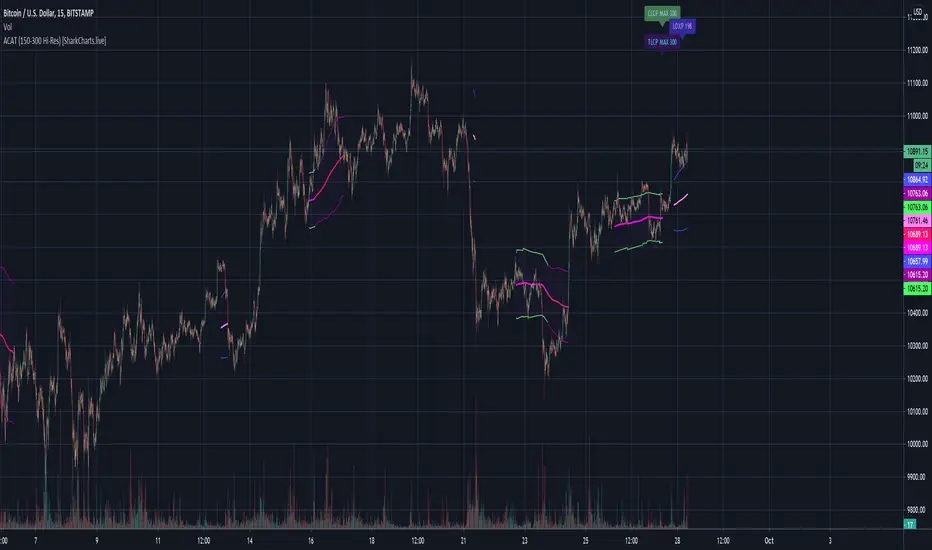
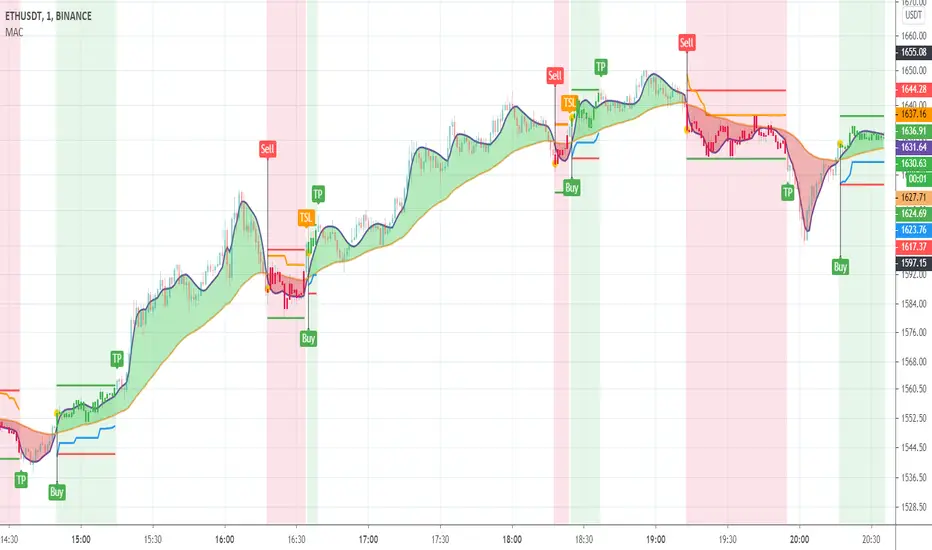
ACAT (150-300 Hi-Res) [acatwithcharts]Adaptive Comprehensive Average Tracker is a 2 in 1 version of Mean Reversion MA and Compression MA. The slightly odd name is a backronym that spells "ACAT" - suffice it to say, I'm pretty proud of what these two indicators have developed into.
This is 2 of 4 in a series of Hi-Res indicators from 14-600 that are intended to be used in concert weaved together. Some of the default display settings are slightly tweaked to account for the assumption that they would not be used by themselves individual. The labels are intended to weave with the other instances of ACAT, which is very obviously not something that was designed for in the v4 labeling code and works about as passably well as I could get it, noting that coming up with a method for setting variable distances that always looks sharp across instruments and timeframes is near-impossible.
Compared to what subscribers will be used to from using standard resolution ACAT, this should greatly sharpen the borders of the compression bands in particular. A key caveat to be aware of is that dividing the range into multiple instances like this means that there can be tracking of several distributions at the same time if different indicators are triggering independently after being reset on different ranges - which in some cases means more relevant periods are being identified but often times can mean a mess of information with some less important periods being overlaid as if they were of equal importance to the longest period lengths.
My volatility indicators are available by subscription in several packages through SharkCharts.live - and this is planned to be the first new one ready to add. I plan to on totally overhauling my explanation videos on ACAT since the indicator just does so much more than it used to when the previous videos were recorded, but as of the time of this writing the videos on Mean Reversion MA, Compression MA, and my livestream with DadShark do cover most parts of it. These videos and videos on my other indicators are currently hosted on DadShark's YouTube channel.
Current pricing and subscription details will be kept up-to-date on SharkCharts.live
Adaptive
ACAT (14-150 Hi-Res) [acatwithcharts]Adaptive Comprehensive Average Tracker is a 2 in 1 version of Mean Reversion MA and Compression MA. The slightly odd name is a backronym that spells "ACAT" - suffice it to say, I'm pretty proud of what these two indicators have developed into.
This is 1 of 4 in a series of Hi-Res indicators from 14-600 that are intended to be used in concert weaved together. Some of the default display settings are slightly tweaked to account for the assumption that they would not be used by themselves individual. The labels are intended to weave with the other instances of ACAT, which is very obviously not something that was designed for in the v4 labeling code and works about as passably well as I could get it, noting that coming up with a method for setting variable distances that always looks sharp across instruments and timeframes is near-impossible.
Compared to what subscribers will be used to from using standard resolution ACAT, this should greatly sharpen the borders of the compression bands in particular. A key caveat to be aware of is that dividing the range into multiple instances like this means that there can be tracking of several distributions at the same time if different indicators are triggering independently after being reset on different ranges - which in some cases means more relevant periods are being identified but often times can mean a mess of information with some less important periods being overlaid as if they were of equal importance to the longest period lengths.
My volatility indicators are available by subscription in several packages through SharkCharts.live - and this is planned to be the first new one ready to add. I plan to on totally overhauling my explanation videos on ACAT since the indicator just does so much more than it used to when the previous videos were recorded, but as of the time of this writing the videos on Mean Reversion MA, Compression MA, and my livestream with DadShark do cover most parts of it. These videos and videos on my other indicators are currently hosted on DadShark's YouTube channel.
Current pricing and subscription details will be kept up-to-date on SharkCharts.live

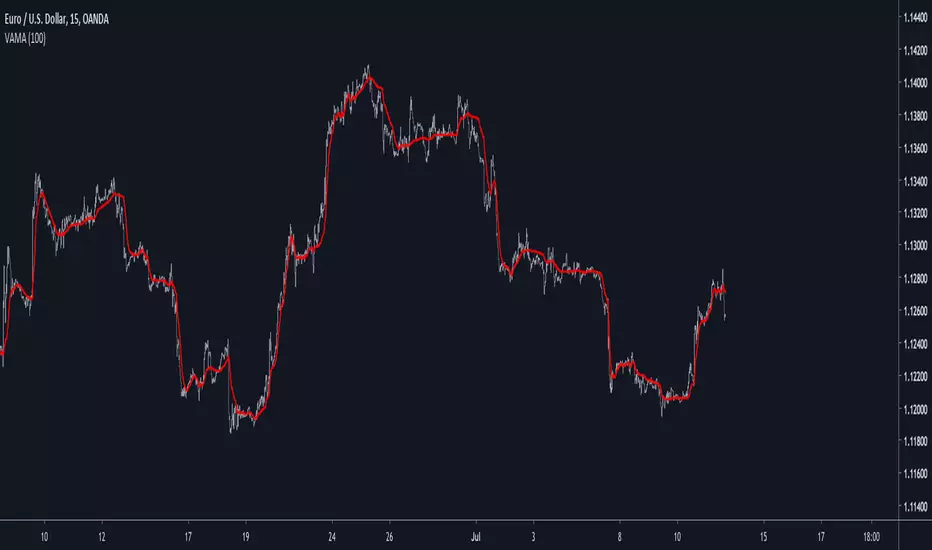
Variable Adaptive Moving AverageAbout This Indicator
This was one of my first indicators, its also the first indicator i made a preprint paper about, i strongly encourage you to read the paper i made here : hal.archives-ouvertes.fr
Dont be triggered by the lack of quality of the paper, i only did it for fun. I might further develop this preprint thus ending with something more readable.
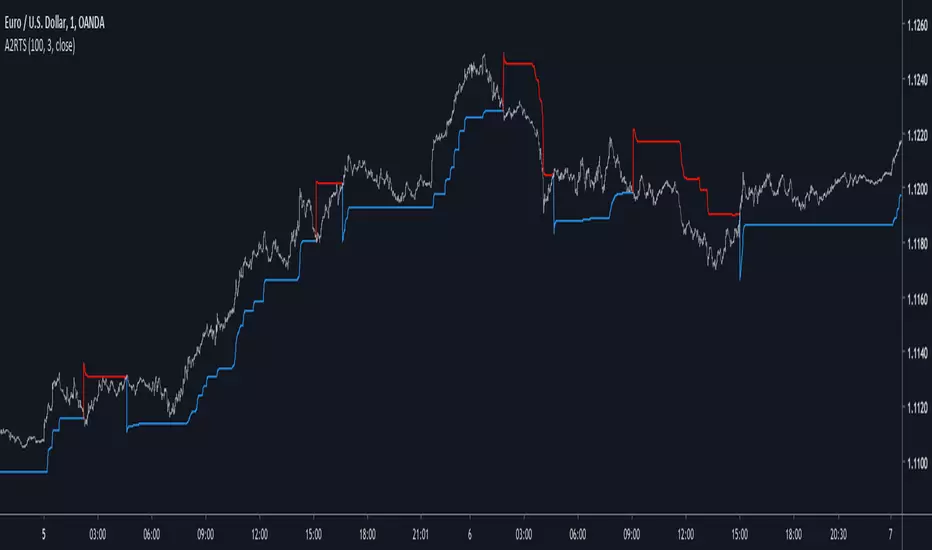
Adaptive Autonomous Recursive Trailing StopIntroduction
Trailing stop are important indicators in technical analysis, today i propose a new trailing stop A2RTS based on my last published indicator A2RMA (1), this last indicator directly used an error measurement thus providing a way to create enveloppes, which provide a direct way to create trailing stops based on highest/lowest rules.
The Indicator
If you need a more detailed explanation of this indicator i encourage you to check the A2RMA indicator post i made, parameters does not differ from the supertrend, thus having a length parameter and a factor parameter who is here described as gamma , gamma control how far away are the bands from each others thus spotting longer terms trends when gamma is higher.
On BTCUSD
Something worth mentioning is that the indicator sometimes behave like my MTA trailing stop indicator (2) who is closer to the price when a trend persist thus providing early exit points, however A2RTS behave a bit better.
Price can sometimes break the trailing stop, this can be interpreted as a support/resistance or just as an exit point, the support resistance methodology on trailing stop is not the most recommended.
Sometimes it is recommended to have an higher length rather than an high gamma like in this case for INTEL CORP, below gamma = 3 and length = 20
The microprocessor market like to use higher length's instead of higher gamma's , A2RMA is a non-linear filter, this would explain such behaviour.
Conclusion
Trailing stops might not suffer as much from whipsaw trades than MA crossovers but they still remain inefficient when market is not trending, results of the proposed indicator on major forex pairs are more than disappointing, but i hope this will serve as basis for other trailing stops that might act a little bit better. I conclude this post by thanking everyone who support my work and i encourage you to modify this indicator and share it with the community.
Thanks for reading !
Cited Articles
Adaptive Autonomous Recursive Moving AverageIntroduction
Using conditions in filters is a way to make them adapt to those, i already used this methodology in one of my proposed indicators ARMA which gave a really promising adaptive filter, ARMA tried to have a flat response when dealing with ranging market while following the price when the market where trending or exhibiting volatile movements, the filter was terribly simple which is one of its plus points but its down points where clearly affecting its performance thus making it almost impractical.
Today i propose a new filter A2ARMA which aim to correct all the bad behaviours of ARMA while having a good performance on various markets thanks to the added adaptivity.
Fixes And Changes
ARMA was dealing with terribles over/under-shoots which affected its performance, adding a zero-lag option made the thing even worse, in order to fix those mistakes i first cleaned the code, then i removed the offset for src in d , this choice is optional but the filter is sometimes more accurate this way.
The major change is the use of an adaptive moving average instead of the triangular moving average that smoothed the output, this adaptive moving average is calculated using exponential averaging while using the efficiency ratio as smoothing variable, this choice surprisingly removed the majority of overshoots while adding more adaptivity to the filter.
The Indicator
The Indicator work the same way as ARMA, not reacting during flat market periods while following the price when this one is volatile or trending. length control the smoothing amount while gamma determine how the filter is affected during flat market periods, gamma = 0 is just a double smoothed adaptive moving average, higher values of gamma will filter flat markets with a certain degree.
On Intel Corp with gamma = 0, i want to filter the flat period starting at July 10, gamma = 3 will certainly help us on this task.
Hooray, the problem appear to be solved ! Lower values of gamma also produce desirable effect as shown below :
gamma = 2
So far so good, but gamma or length might have different optimal values depending on the market, also problems still exists as shown here :
Seagate is tricky, gamma at 2.4 might help
The relationship between length and gamma is somewhat complicated.
On Different Markets
While some filters will process market price the same way no matter the market they are affected, A2ARMA will change drastically depending of the market.
On AMD
On EURUSD
On BTCUSD
Comparison With ARMA
ARMA with parameters roughly matching A2RMA, overall most of the problems i wanted to fix where indeed fixed.
Conclusion
A huge thanks for the support i received during this "Blank Page" period i'am suffering, ARMA was an indicator i really wanted to further develop without giving up on the code simplicity and i think this version might provide useful results, we can also notice that the decision making is easier with this version of the indicator thanks to the added coloring (which would have been impossible with ARMA).
My work don't have license attached to it, feel free to modify and share your findings, mentioning is appreciated :)
Thanks for reading !

Adaptive BB Triple Layer Adaptive BB SD
Band based pullback and pivoting signals ♘♝
Macro Trend sentiment - Outer deviations coloring
Micro trend - Mean Value and normal +/- st.dev colors
Candle Colors - Median Trend
Col Coded Primitive(Basic) Squeeze detection
Sensitive micro break out/down signals derived from basic Mean line crossing (Added some Whipsaw Protection)
Basic Squeeze
Extreme deviations can be turned off for "compact" view
Basic break out/down signals
Indicator needs TESTING
Signal sensitivity and trend recognition need testing/tuning before even considering to use this BB for trading purposes

Ehlers Ideal RSIThis script has been updated to Pine v4. Original script by JustUncleL (link in code)
Moving Average CrossoverIt was planned as an addition to Moving Average Smoothness Benchmark and Profitable Moving Average Crossover , but can be used standalone.
Supports 62 types of well-known moving averages and allows full-featured customization.
Supported types of averages and filters:
AEMA , Adaptive Exponential MA (by Vitali Apirine)
AHMA , Ahrens MA (by Richard D. Ahrens)
ALMA , Arnaud Legoux MA (by Arnaud Legoux and Dimitris Kouzis-Loukas)
ALF , Adaptive Laguerre Filter (by John F. Ehlers)
AMA , Adaptive MA (by Vitali Apirine)
ARSI , Adaptive RSI
BAMA , Bryant Adaptive MA (by Michael R. Bryant)
BF2 , Butterworth Filter with 2 poles
BF3 , Butterworth Filter with 3 poles
DEMA , Double Exponential MA (by Patrick G. Mulloy)
DWMA , Double Weighted (Linear) MA
EDCF , Ehlers Distance Coefficient Filter (by John F. Ehlers)
EDSMA , Ehlers Deviation-Scaled MA (by John F. Ehlers)
EHMA , Exponential Hull MA
EMA , Exponential MA
EVWMA , Elastic Volume Weighted MA (by Christian P. Fries)
FRAMA , Fractal Adaptive MA (by John F. Ehlers)
GF1 , Gaussian Filter with 1 pole
GF2 , Gaussian Filter with 2 poles
GF3 , Gaussian Filter with 3 poles
GF4 , Gaussian Filter with 4 poles
HFSMA , Hampel Filter on Simple Moving Average
HFEMA , Hampel Filter on Exponential Moving Average
HMA , Hull MA (by Alan Hull)
HWMA , Henderson Weighted MA (by Robert Henderson)
IDWMA , Inverse Distance Weighted MA
IIRF , Infinite Impulse Response Filter (by John F. Ehlers)
JAMA , Jurik Adaptive MA (by Mark Jurik)
JMA , Jurik MA (by Mark Jurik, )
KAMA , Kaufman Adaptive MA (by Perry J. Kaufman)
LF , Laguerre Filter (by John F. Ehlers)
LMA , Leo MA (by ProRealCode' user Leo)
LSMA , Least Squares MA (Moving Linear Regression)
MAMA (by John F. Ehlers)
FAMA , Following Adaptive MA (by John F. Ehlers)
MD , McGinley Dynamic (by John R. McGinley)
MHLMA , Middle-High-Low MA (by Vitali Apirine)
MNMA , McNicholl MA (by Dennis McNicholl)
NSMA , Moving Average 3.0 on SMA (by Manfred G. Dürschner)
NEMA , Moving Average 3.0 on EMA (by Manfred G. Dürschner)
NWMA , Moving Average 3.0 on WMA (by Manfred G. Dürschner)
NVWMA , Moving Average 3.0 on VWMA (by Manfred G. Dürschner)
PEMA , Pentuple Exponential MA (by Bruno Pio)
PWMA , Parabolic Weighted MA
QMA , Quick MA (by John McCormick)
QEMA , Quadruple Exponential MA (by Bruno Pio)
REMA , Regularized Exponential MA (by Chris Satchwell)
RMA , Running MA (by J. Welles Wilder)
RMF , Recursive Median Filter (by John F. Ehlers )
RMTA , Recursive Moving Trend Average (by Dennis Meyers)
SHMMA , Sharp Modified MA (by Joe Sharp)
SMA , Simple MA
SSF2 , Super Smoother Filter with 2 poles (by John F. Ehlers)
SSF3 , Super Smoother Filter with 3 poles (by John F. Ehlers)
SWMA , Sine Weighted MA
TEMA , Triple Exponential MA (by Patrick G. Mulloy)
TMA , Triangular MA (generalized by John F. Ehlers)
T3 , (by Tim Tillson)
VIDYA , Variable Index Dynamic Average (by Tushar S. Chande)
VWMA , Volume Weighted MA (by Buff P. Dormeier)
WMA , Weighted (Linear) MA
ZLEMA , Zero Lag Exponential MA (by John F. Ehlers and Ric Way)
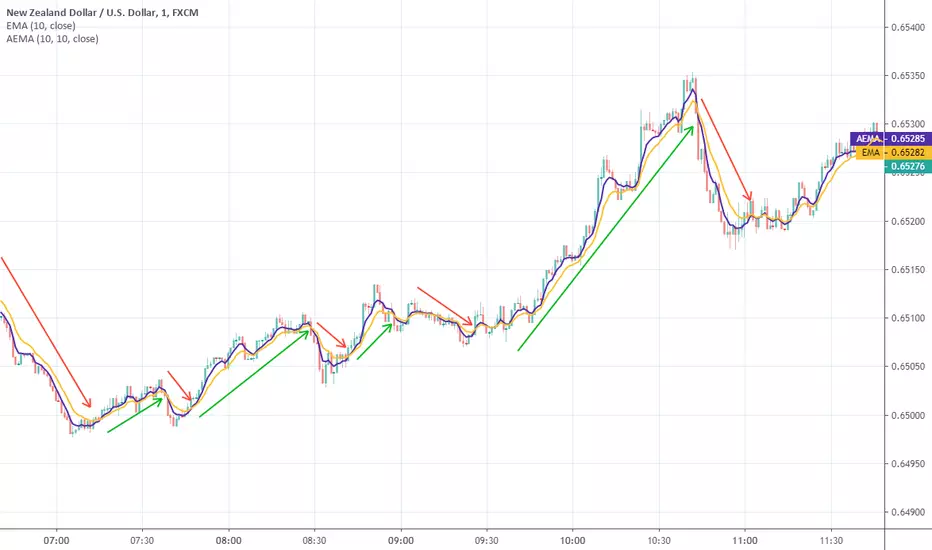
Adaptive Exponential Moving AverageThis indicator was originally developed by Vitali Apirine (Stocks & Commodities V. 37:5 (April, 2019): Adaptive Exponential Moving Average ).
This is his second modification of Kaufman Moving Average. In essence, the idea remains the same as in the previous ( ): the smoothing constant is calculated as a special ratio between the current price and highest/lowest prices for a given period.
In combination with EMA you can obtain a trading system based on double crossovers:
Long , when AEMA crosses up EMA
Short , when AEMA crosses down EMA
Source code on request
Autonomous Recursive Moving AverageIntroduction
People often ask me what is my best indicators, i can't really respond to this question with a straight answer but i would say you to check this indicator. The Autonomous Recursive Moving Average (ARMA) is an adaptive moving average that try to minimize the sum of squares thanks to a ternary operator, this choice can seem surprising since most of the adaptive moving averages adapt to a smoothing variable thanks to exponential averaging, but there are lot of downsides to this method, i really wanted to have a flat filter during flat markets and this is what i achieved.
The Indicator
length control the amount of smoothing during trending periods, gamma is the trend sensitivity threshold, higher values of gamma will make an overall flat filter, adjust gamma to skip ranging markets.
gamma = 2, we can adjust to 3 while preserving smoothing reactivity with trading periods.
gamma = 3
low length and higher gamma create more boxy result, the filter add overshoots directly in the output, its unfortunate.
The Zero-Lag option can reduce the lag as well as getting additional flat results without changing gamma.
Conclusion
The indicator need work, but i can't leave without publishing it, the overshoots are a big problems, changing sma for another stable filter can help. I hope you find an use to it, i really like this indicator.
Thanks for reading
Jurik Adaptive Moving AverageThis is Jurik Research's original moving average and a predecessor of the well-known Jurik Moving Average (JMA). It was developed by Mark Jurik in 1994. The purpose was the same: to create the best noise reduction filter.
The algorithms of JAMA and JMA have big differences. JAMA is less responsive than JMA - sometimes it makes it better than JMA but closely depends on the objective assigned to it.
On the screenshots you can see how they behave together with different period settings.
The red line is JAMA, the purple line is JMA .
Period: 7
BTCUSD, D
AAPL, D
Period: 14
BTCUSD, D
AAPL, D
Period: 50
BTCUSD, D
AAPL, D
Reference: www.jurikres.com

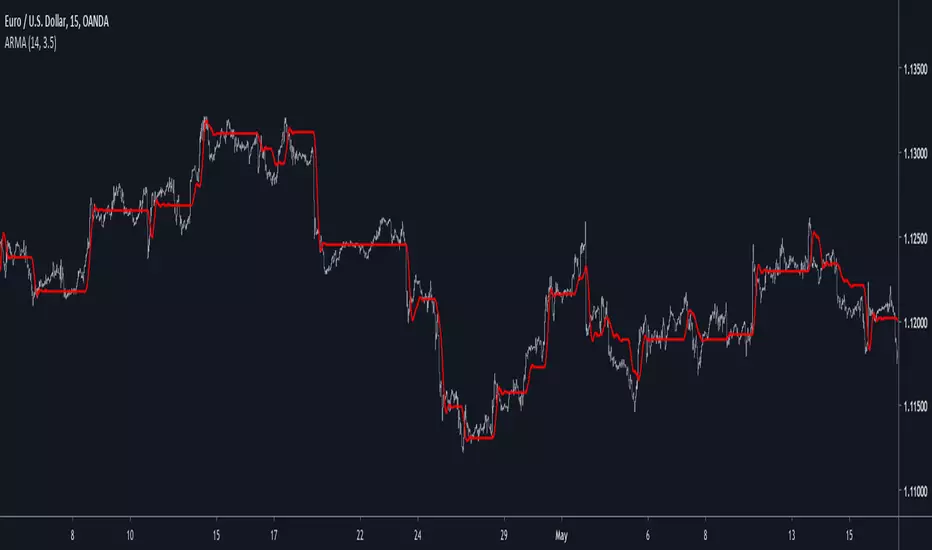
Ratio OCHL Averager - An Alternative to VWAPIntroduction
I had the idea to make this indicator thanks to @dpanday with the support of @Coppermine and @Reika. Vwap is a non parametric indicator based on volume used by lot of traders and institutions, its non parametric particularity makes it great because it don't need to go through parameter optimization. Today i present a similar indicator called Ratio OCHL Averager based on exponential averaging by using the ratio of open-close to high-low range by using monthly high/low.
The Indicator
The indicator can more recursive by checking the "recursive" option, this allow to use the indicator output instead of the open price for the calculation of the ratio of open-close to high-low range. The result is a more reactive estimation,
The indicator reactivity change based on the time frame you are in, using higher time frame result in a more reactive indicator, however it is way less reactive than the vwap, this is a personal choice since i wanted this indicator to be smooth even with high time frames, if you want to change that you use another resolution for H and L in line 5,6.
Conclusion
I presented an alternative to vwap based on the Ratio OCHL indicator. I hope you like it and thanks for reading !
Thanks to Coppermine and Reika for the support during the creation of the indicator

Volume Adaptive BandsIntroduction
I have been asked by @Coppermine and @Verbena to make bands that use volume to provide adaptive results. My first approach was to use exponential averaging, in order to do so i needed to quantify volume movement using rescaling with the objective to make the bands go away from each others when there is low volume, this approach is efficient and can work on any time frame, however i decided at the end to use another method which rely on recursive weighting, cleaner but more parametric. Those bands aim to highlight great breakouts point to go with the trend.
The Indicator
length control the period of the moving averages used in the script, however low length's don't necessarily provide indications for shorter terms breakouts as shown here :
As i said the bands are close to each others when there is high volume and away when there is low volumes.
Low volume period, bands will avoid to cross price
High volume, bands will be close to generate signals.
Correction Factor
Higher time frames will lower the distance between each band, this is because volume is higher during higher time frames, remember that the indicator bands are close to each others when volume is high.
1h chart eurusd.
This is why i added a correction factor, this factor can help you control the distance between each bands, when the correction factor is greater than 1 the bands will be closer to each others, this is useful for low time frames where the average volume is lower. When the time frame is high, use values between 0 and 1 to increase distance between each bands.
Correction factor = 0.2
Conclusion
I presented a new adaptive band indicator that adapt to trading volume by using recursive weighting, volume can be replaced by other indicators but you can have results going nuts, at the end its about experimentation. I hope you will find an use to it, thanks to @Coppermine and @Verbena for the request :)
Thanks for reading !

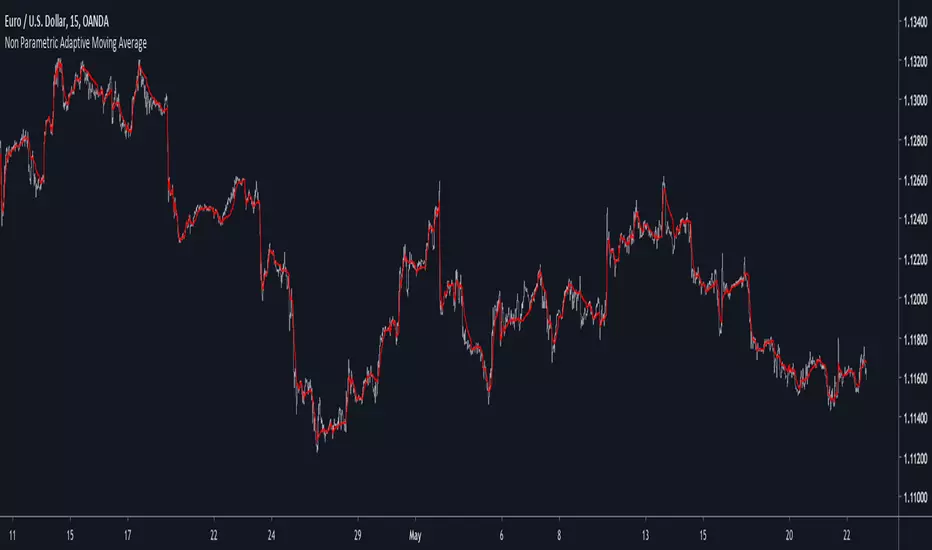
Non Parametric Adaptive Moving AverageIntroduction
Not be confused with non-parametric statistics, i define a "non-parametric" indicator as an indicator who does not have any parameter input. Such indicators can be useful since they don't need to go through parameter optimization. I present here a non parametric adaptive moving average based on exponential averaging using a modified ratio of open-close to high-low range indicator as smoothing variable.
The Indicator
The ratio of open-close to high-low range is a measurement involving calculating the ratio between the absolute close/open price difference and the range (high - low) , now the relationship between high/low and open/close price has been studied in econometrics for some time but there are no reason that the ohlc range ratio may be an indicator of volatility, however we can make the hypothesis that trending markets contain less indecision than ranging market and that indecision is measured by the high/low movements, this is an idea that i've heard various time.
Since the range is always greater than the absolute close/open difference we have a scaled smoothing variable in a range of 0/1, this allow to perform exponential averaging. The ratio of open-close to high-low range is calculated using the vwap of the close/high/low/open price in order to increase the smoothing effect. The vwap tend to smooth more with low time frames than higher ones, since the indicator use vwap for the calculation of its smoothing variable, smoothing may differ depending on the time frame you are in.
1 minute tf
1 hour tf
Conclusion
Making non parametric indicators is quite efficient, but they wont necessarily outperform classical parametric indicators. I also presented a modified version of the ratio of open-close to high-low range who can provide a smoothing variable for exponential averaging. I hope the indicator can help you in any way.
Thanks for reading !
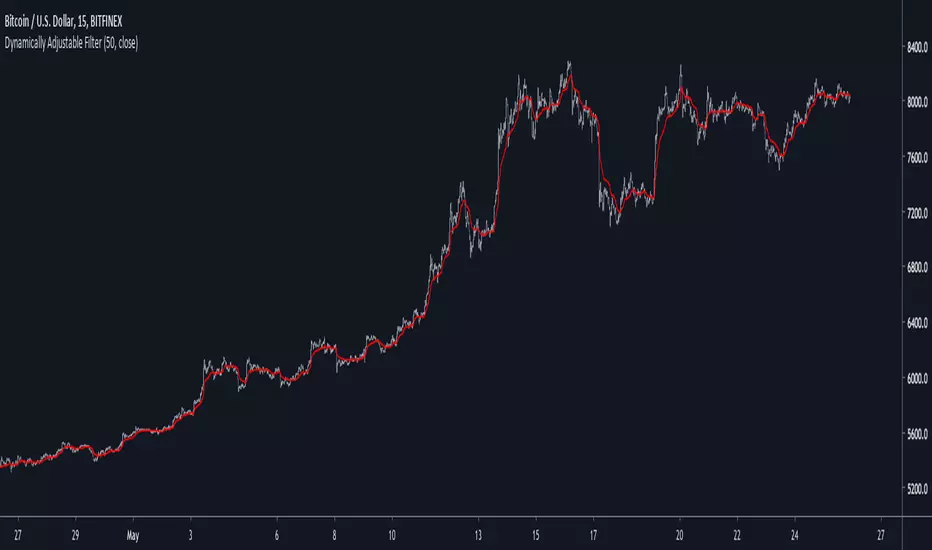
Dynamically Adjustable FilterIntroduction
Inspired from the Kalman filter this indicator aim to provide a good result in term of smoothness and reactivity while letting the user the option to increase/decrease smoothing.
Optimality And Dynamical Adjustment
This indicator is constructed in the same manner as many adaptive moving averages by using exponential averaging with a smoothing variable, this is described by :
x= x_1 + a(y - x_1)
where y is the input price (measurements) and a is the smoothing variable, with Kalman filters a is often replaced by K or Kalman Gain , this Gain is what adjust the estimate to the measurements. In the indicator K is calculated as follow :
K = Absolute Error of the estimate/(Absolute Error of the estimate + Measurements Dispersion * length)
The error of the estimate is just the absolute difference between the measurements and the estimate, the dispersion is the measurements standard deviation and length is a parameter controlling smoothness. K adjust to price volatility and try to provide a good estimate no matter the size of length . In order to increase reactivity the price input (measurements) has been summed with the estimate error.
Now this indicator use a fraction of what a Kalman filter use for its entire calculation, therefore the covariance update has been discarded as well as the extrapolation part.
About parameters length control the filter smoothness, the lag reduction option create more reactive results.
Conclusion
You can create smoothing variables for any adaptive indicator by using the : a/(a+b) form since this operation always return values between 0 and 1 as long as a and b are positive. Hope it help !
Thanks for reading !
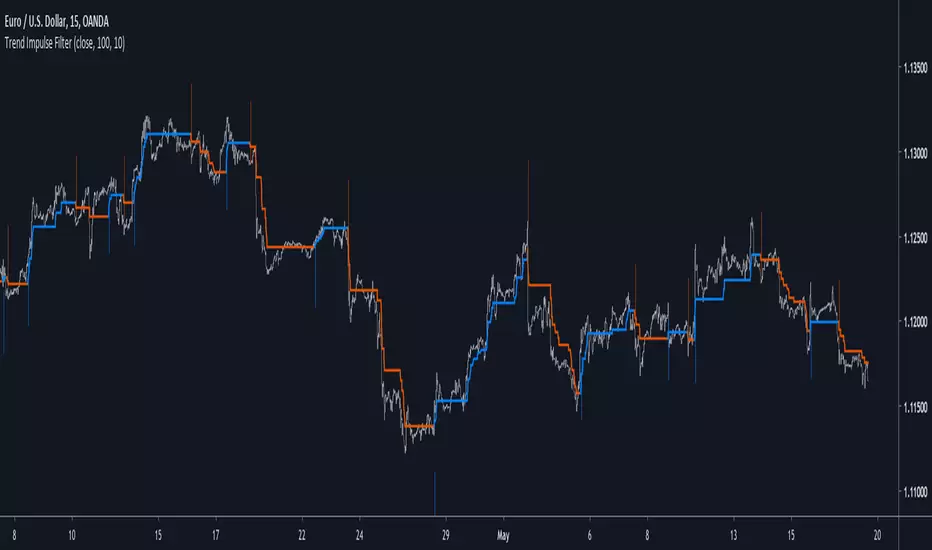
Trend Impulse FilterIntroduction
There is a lot of indicators similar to this one, however i think this one don't share the same calculation method and this is why i share it. This indicator aim to forecast price direction using an exponential filter architecture using highest and lowest information for the estimation of a smoothing variable. This filter is similar to the average Max-Min filter.
The Indicator
In the code a is equal to 1 when the price is greater or lower than any past price over length period, else a is equal to 0. The center parameter control the filtering degree of the output, when center is equal to 1 and a = 1 the indicator return the highest or lowest depending on market current trend, when center is superior to 1 the output will be smoother, however the reactivity of the indicator will still depend on the length parameter.
A color option show you the trend of the market, however the generated signals are the same that can be generated from a Donchian channel.
When highest is greater than previous highest the indicator direction will move upward, else if lowest is lower than previous lowest the indicator direction will move downward. Therefore the indicator can give information on the Donchian channels direction and provide a nice filter.
Conclusions
Adapting to highest and lowest can make an indicator adapt to the essence of trend trading, the indicator i showed can be used as source for others indicator or in MA crossover strategies. If you have a strategy using Donchian channels you may be interested in using this indicator and se how it fit in your strategy. Hope you like it.
Thanks for reading !
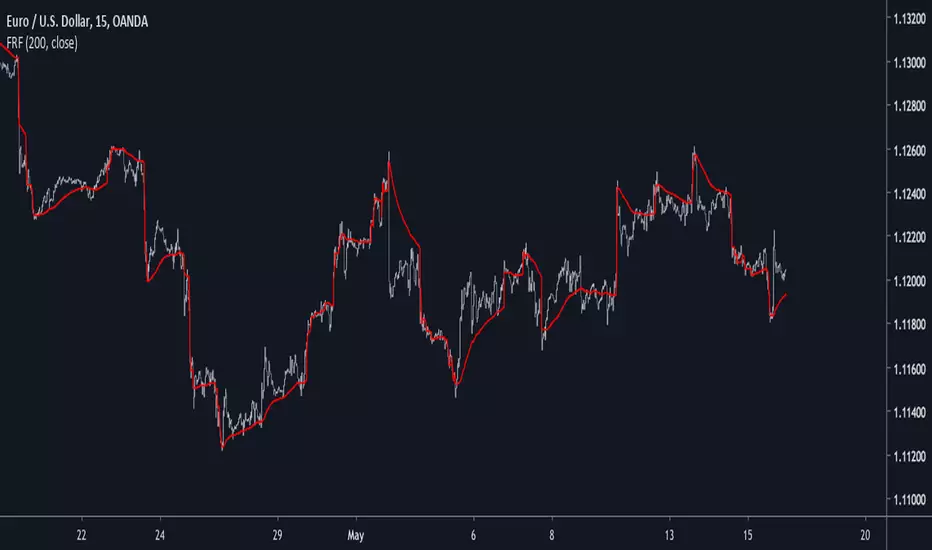
Falling-Rising FilterIntroduction
This is a modification of an old indicator i made. This filter aim to adapt to market trend by creating a smoothing constant using highest and lowest functions. This filter is visually similar to the edge-preserving filter, this similarity can make this filter quite good for MA cross strategies.
On The Filter Code
a = nz(a ) + alpha*nz(error ) + beta*nz(error )
The first 3 terms describe a simple exponential filter where error = price - a , beta introduce the adaptive part. beta is equal to 1 when the price is greater or lower than any past price over length period, else beta is equal to alpha , someone could ask why we use two smoothing variable (alpha, beta) instead of only beta thus having :
a = nz(a ) + beta*nz(error )
well alpha make the filter converge faster to the price thus having a better estimation.
In blue the filter using only beta and in red the filter using alpha and beta with both length = 200 , the red filter converge faster to the price, if you need smoother results but less precise estimation only use beta .
Conclusion
I have presented a simple indicator using rising/falling functions to calculate an adaptive filter, this also show that when you create an exponential filter you can use more terms instead of only a = a + alpha*(price - a ) . I hope you find this indicator useful.
Thanks for reading !
♒RBCI - Range Bound Channel Index by Cryptorhythms♒ RBCI - Range Bound Channel Index by Cryptorhythms
Intro
This is my best approximation of the RBCI. Its not perfect, but it does the job well enough.
A good way to use it is to enter when the singal line (light blue) RE ENTERS the channel from below. I circled these points on the indicator in green.
Description
Information to create was gathered mostly here: www.finware.com
RBCI (Range Bound Channel Index) – is calculated by means of the channel (bandwidth) filter (CF). Channel filter simultaneously fulfills two functions:
Removes low frequent trend formed by low frequent components of the spectrum with periods, more T2= 1/fc2;
Removes high frequency noise formed by the high frequent components of the spectrum with periods, less T1= 1/fc1.
👍 Enjoying this indicator or find it useful? Please give me a like and follow! I post crypto analysis, price action strategies and free indicators regularly.
💬 Questions? Comments? Want to get access to an entire suite of proven trading indicators? Come visit us on telegram and chat, or just soak up some knowledge. We make timely posts about the market, news, and strategy everyday. Our community isn't open only to subscribers - everyone is welcome to join.
For Trialers & Chat: t.me

Dynamically Adjustable Moving AverageIntroduction
The Dynamically Adjustable Moving Average (AMA) is an adaptive moving average proposed by Jacinta Chan Phooi M’ng (1) originally provided to forecast Asian Tiger's futures markets. AMA adjust to market condition in order to avoid whipsaw trades as well as entering the trending market earlier. This moving average showed better results than classical methods (SMA20, EMA20, MAC, MACD, KAMA, OptSMA) using a classical crossover/under strategy in Asian Tiger's futures from 2014 to 2015.
Dynamically Adjustable Moving Average
AMA adjust to market condition using a non-exponential method, which in itself is not common, AMA is described as follow :
1/v * sum(close,v)
where v = σ/√σ
σ is the price standard deviation.
v is defined as the Efficacy Ratio (not be confounded with the Efficiency Ratio) . As you can see v determine the moving average period, you could resume the formula in pine with sma(close,v) but in pine its not possible to use the function sma with variables for length, however you can derive sma using cumulation.
sma ≈ d/length where d = c - c_length and c = cum(close)
So a moving average can be expressed as the difference of the cumulated price by the cumulated price length period back, this difference is then divided by length. The length period of the indicator should be short since rounded version of v tend to become less variables thus providing less adaptive results.
AMA in Forex Market
In 2014/2015 Major Forex currencies where more persistent than Asian Tiger's Futures (2) , also most traded currency pairs tend to have a strong long-term positive autocorrelation so AMA could have in theory provided good results if we only focus on the long term dependency. AMA has been tested with ASEAN-5 Currencies (3) and still showed good results, however forex is still a tricky market, also there is zero proof that switching to a long term moving average during ranging market avoid whipsaw trades (if you have a paper who prove it please pm me) .
Conclusion
An interesting indicator, however the idea behind it is far from being optimal, so far most adaptive methods tend to focus more in adapting themselves to market complexity than volatility. An interesting approach would have been to determine the validity of a signal by checking the efficacy ratio at time t . Backtesting could be a good way to see if the indicator is still performing well.
References
(1) J.C.P. M’ng, Dynamically adjustable moving average (AMA’) technical
analysis indicator to forecast Asian Tigers’ futures markets, Physica A (2018),
doi.org
(2) www.researchgate.net
(3) www.ncbi.nlm.nih.gov
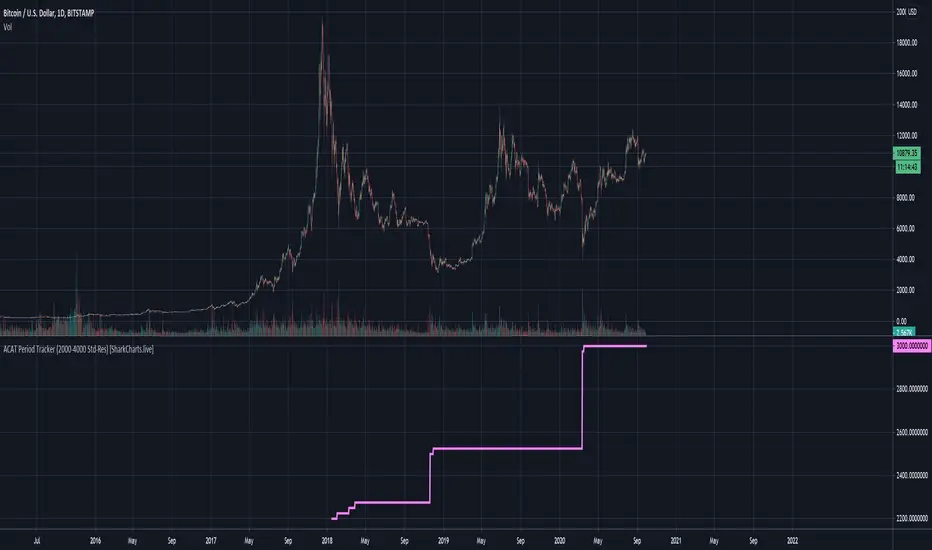
ACAT Period Tracker (2000-4000 Std-Res) [acatwithcharts]This is the corresponding period length tracker for ACAT (2000-4000 Std-Res). The constraints of Pinescript make it necessary to plot a separate indicator in a separate window to actually read out the period numbers without massively skewing the chart by default.
My volatility indicators are available by subscription in several packages through SharkCharts.live - and this is planned to be the first new one ready to add. I plan to release a video explaining how to use this indicator coinciding with launch, as there's a lot to talk about. Videos on my other indicators are currently hosted on DadShark's YouTube channel.
Current pricing and subscription details will be kept up-to-date on SharkCharts.live
ACAT (2000-4000 Std-Res) [acatwithcharts]Adaptive Comprehensive Average Tracker is a 2 in 1 version of Mean Reversion MA and Compression MA. The slightly odd name is a backronym that spells "ACAT" - suffice it to say, I'm pretty proud of what these two indicators have developed into.
The best solution I've managed to find to the variable count limits in Pinescript is to split the indicator into two that cover different ranges - and that aspect also theoretically allows for some other variations.
I've had difficulty increasing the resolution much without needing a huge number of individual indicators and running into constant Pinescript timeout issues. One thing that I can do, however, is extend the range further out.
Note that "Std-Res" here for this higher range was decided mostly based on, "What do I think I can get to work for higher than 2000 about as often as the existing 600-2000 indicator?" and is semi-arbitrary. At higher period lengths, the spread between different MAs decreases so less resolution is needed, while the calculation times increase dramatically, so this script is necessarily a lot less dense than the lower lengths. Sometimes this will load much faster as a result. I'm generally finding both struggle on shorter timeframes.
Keep in mind some caveats: resolution at these lengths is lower and finding relevant period lengths this far out necessarily means you should be trading them on higher timeframes. If you see something on the 3000 period on the 4h, you're talking about events happening near W benchmark length moving averages. If you see something in these periods lengths on the D timeframe as with some parabolic bubbles/crashes, you're looking at very macro pivots and targets happening near M benchmark length moving averages.
My volatility indicators are available by subscription in several packages through SharkCharts.live - and this is planned to be the first new one ready to add. I plan to release a video explaining how to use this indicator coinciding with launch, as there's a lot to talk about. Videos on my other indicators are currently hosted on DadShark's YouTube channel.
Current pricing and subscription details will be kept up-to-date on SharkCharts.live

ACAT (600-2000 Std-Res) [acatwithcharts](This is a reupload to help standardize the names in the invite-only indicators listing, which was otherwise doomed to be forever confusing.)
Adaptive Comprehensive Average Tracker is a 2 in 1 version of Mean Reversion MA and Compression MA. The slightly odd name is a backronym that spells "ACAT" - suffice it to say, I'm pretty proud of what these two indicators have developed into.
The best solution I've managed to find to the variable count limits in Pinescript is to split the indicator into two that cover different ranges. This version covers period lengths from 600-2000 at the same resolution seen in Mean Reversion MA and Compression MA. I've then added a toggle-able feature to hide the lower indicator's plot while it's maxed out which makes them look roughly stitched together and has a nice added benefit that it require less work by the higher period script so it loads more quickly.
The hope is to replace several indicators that have periodic issues timing out with fewer, which should be substantially more convenient to use and on average mean dealing with fewer refreshes.
My volatility indicators are available by subscription in several packages through SharkCharts.live - and this is planned to be the first new one ready to add. I plan to release a video explaining how to use this indicator coinciding with launch, as there's a lot to talk about. Videos on my other indicators are currently hosted on DadShark's YouTube channel.
Current pricing and subscription details will be kept up-to-date on SharkCharts.live

ACAT (14-600 Std-Res) [acatwithcharts]
(This is a reupload to help standardize the names in the invite-only indicators listing, which was otherwise doomed to be forever confusing.)
Adaptive Comprehensive Average Tracker is a 2 in 1 version of Mean Reversion MA and Compression MA. The slightly odd name is a backronym that spells "ACAT" - suffice it to say, I'm pretty proud of what these two indicators have developed into.
The best solution I've managed to find to the variable count limits in Pinescript is to split the indicator into two that cover different ranges. This version covers period lengths from 14-600 at the same resolution seen in the "600 Max" versions of Mean Reversion MA and Compression MA. I've then added a toggle-able feature to hide the lower indicator's plot while it's maxed out which makes them look roughly stitched together and has a nice added benefit that it require less work by the higher period script so it loads more quickly.
The hope is to replace several indicators that have periodic issues timing out with fewer, which should be substantially more convenient to use and on average mean dealing with fewer refreshes.
My volatility indicators are available by subscription in several packages through SharkCharts.live - and this is planned to be the first new one ready to add. I plan to release a video explaining how to use this indicator coinciding with launch, as there's a lot to talk about. Videos on my other indicators are currently hosted on DadShark's YouTube channel.
Current pricing and subscription details will be kept up-to-date on SharkCharts.live
