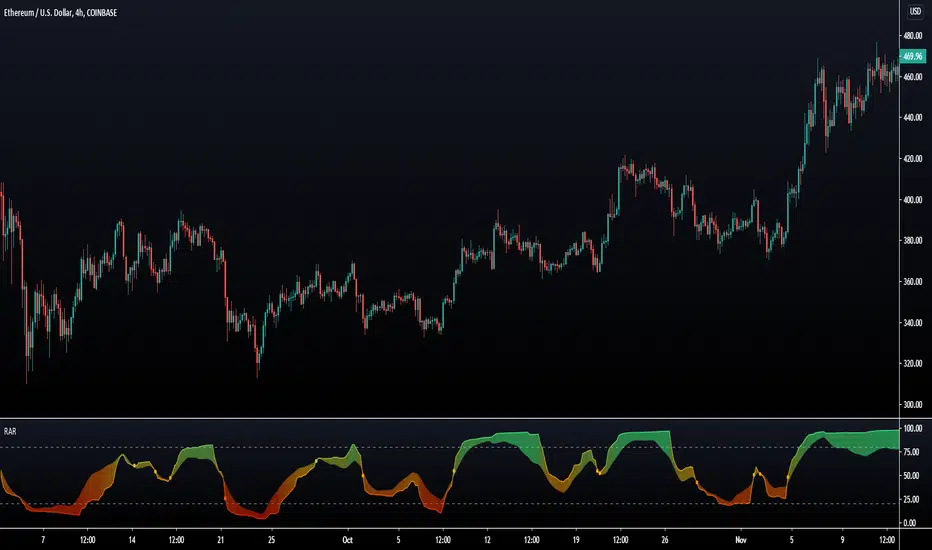
The Trend Oracle - The Ultimate Position ToolThe Trend Oracle is a superadaptive multi-timeframe Indicator
Ideal timeframes are 4H, and 1D
It is based on a combination of several other indicators including:
- The Superstrength Index - An adaptive indicator using volume weighted average of the traditional RSI, MFI and OBV
- The Superfast MACD - An adaptive zero lag MACD
- ADX Trend - A tweaked version of the ADX
- Chop Zones - A combination of 2 Chop indexes to identify trending and non trending conditions.
- The Adaptive Supertrend - An adaptive version of the Supertrend, (switching multipliers based on the market trend)
- Breakout & Breakdown - An algorithm computing volume compression and expansion to indicate breakout & breakdown signals.
- [bBullish and Bearish Divergences - Confirmed Bull and Bear divs shown as green and red dots at the top and bottom of the indicator.
Areas highlighted in Aqua are bullish, red are bearish.
Use this indicator as a tool to position yourself over longer timeframes.
Enjoy!
MM :)
Adaptive Moving Average (AMA)

Rainbow Adaptive RSI [LuxAlgo]The following oscillator uses an adaptive moving average as an input for another RSI oscillator and aims to provide a way to minimize the impact of retracements over the oscillator output without introducing significant lag.
An additional trigger line is present in order to provide entry points from the crosses between the oscillator and the trigger line. More details are given below.
Settings
Length : period of the oscillator
Power : controls the sensitivity of the oscillator to retracements, with higher values minimizing the sensitivity to retracements.
Src : source input of the indicator
The indicator also includes the following graphical settings:
Gradient : Determines the color mode to use for the gradient, options include "Red To Green", "Red To Blue" and "None", with "None" displaying no gradient.
Color fill : Determines whether to fill the area between the oscillator and the trigger line or not, by default "On".
Circles : Determines whether to show circles highlighting the crosses between the oscillator and the trigger line.
Usage
The indicator can be used like any normalized oscillator, but unlike a classical RSI, it does not converge toward 50 with higher length values. This is caused by the RSI using a smooth input.
The power setting will minimize the impact of certain variations on the oscillator:
Here the oscillator at the bottom uses a power value of 1.5.
The trigger line is a smoothed RSI using an EMA as input, and it won't remain as near to 100 and 0 as the main oscillator. Using a moving average of the main oscillator as a trigger line would create faster crosses, but this approach allows us to have no crosses when a retracement is present.
Details
As previously discussed the main oscillator uses an adaptive moving average as input; this adaptive moving average is computed using a smoothing factor derived from an RSI oscillator, a similar adaptive moving average known as ARSI, but unlike ARSI which uses a classical RSI of the closing price for the calculation of the smoothing factor, our smoothing factor makes use of RSI on the adaptive moving average error, which provides a higher level of adaptiveness.
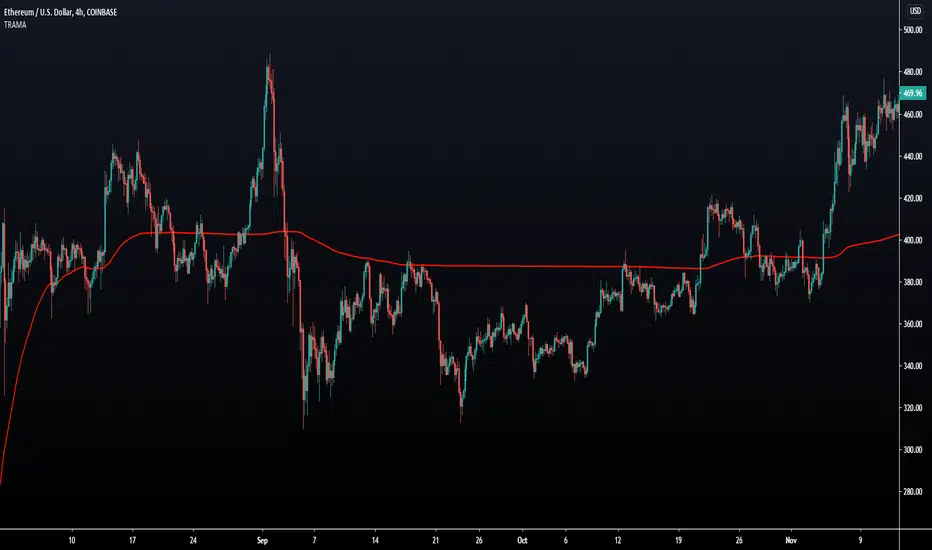
Trend Regularity Adaptive Moving Average [LuxAlgo]The following moving average adapt to the average number of highest high/lowest low made over a specific period, thus adapting to trend strength. Interesting results can be obtained when using the moving average in a MA crossover system or as a trailing support/resistance.
Settings
Length : Period of the indicator, with higher values returning smoother results.
Src : Source input of the indicator.
Usage
The trend regularity adaptive moving average (TRAMA) can be used like most moving averages, with the advantage of being smoother during ranging markets.
Notice how the moving closer to the price the longer a trend last, such effect can be practical to have early entry points when using the moving average in a MA crossover system, such effect is due to the increasing number of average highest high/lowest low made during longer trends. Note that in the case of a significant uptrend followed by a downtrend, the moving average might penalize the start of the downtrend (and vice versa).
The moving average can also act as an interesting trailing support/resistance.
Details
The moving average is calculated using exponential averaging, using as smoothing factor the squared simple moving average of the number of highest high/lowest low previously made, highest high/lowest low are calculated using rolling maximums/minimums.
Using higher values of length will return fewer highest high/lowest low which explains why the moving average is smoother for higher length values. Squaring allows the moving average to penalize lower values, thus appearing more stationary during ranging markets, it also allows to have some consistency regarding the length setting.
🧙 this moving average would not be possible without the existence of corn syrup 🦎
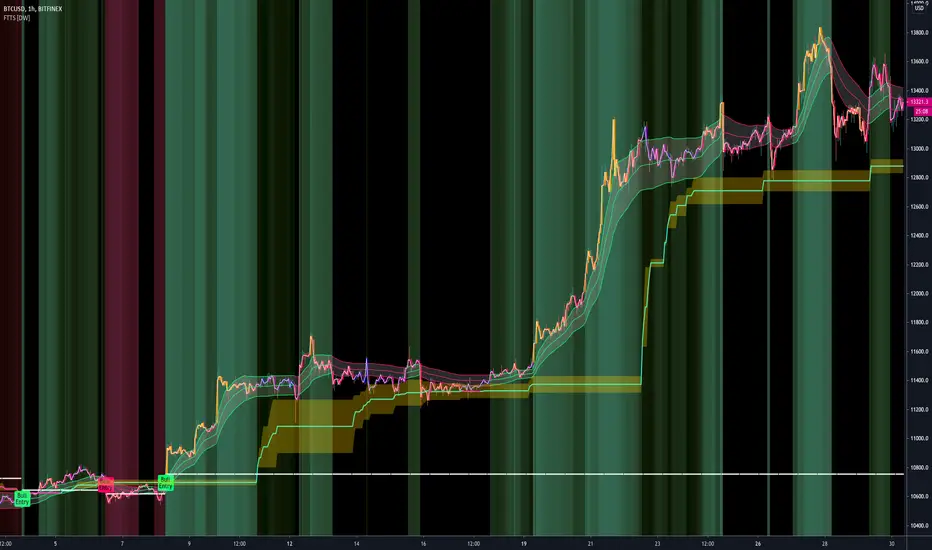
Fractal Trend Trading System [DW]This is an advanced utility that uses fractal dimension and trend information to generate useful insights about price activity and potential trade signals.
In this script, my Advanced FDI algorithm is used to estimate the fractal dimension of the dataset over a user defined period.
Fractal dimension, unlike spatial or topological dimension, measures how complexity or detail in an "object" changes as its unit of measurement changes, rather than the number of axes it occupies.
Many forms of time series data (seismic data, ECG data, financial data, etc.) have been theoretically shown to have limited fractal properties.
Consequently, we can estimate the fractal dimension from this data to get an approximate measure of how rough or convoluted the data stream is.
Financial data's fractal dimension is limited to between 1 and 2, so it can also be used to roughly approximate the Hurst Exponent by the relationship H = 2 - D.
When D=1.5, data statistically behaves like a random walk. D above 1.5 can be considered more rough or "mean reverting" due to the increase in complexity of the series.
D below 1.5 can be considered more prone to trending due to the decrease in complexity of the series.
In this script, you are given the option to apply my Band Shelf EQ algorithm to the dataset before estimating dimension.
This enables you to transform your data and observe how its newly measured complexity changes the outputs.
Whether you want to give emphasis to some frequencies, isolate specific bands, or completely alter the shape of your waveform, EQ filtration makes for an interesting experience.
The default EQ preset in this script removes the low shelf, then attenuates low end and high end oscillations.
The dominant cyclical components (bands 3 - 5 on default settings) are passed at 100%, keeping emphasis on 8 to 64 sample per cycle oscillations.
The estimated dimension is then used to calculate the High Dimension Zone and the Error Bands.
Both of these components are great for analyzing trends and for estimating support and resistance values.
The High Dimension Zone is composed of a high line, low line, and midline that update their values when D is at or above the user defined zone activation threshold.
The zone is then averaged over a user defined amount of updates and zone width is multiplied by a user defined value.
The Error Bands are composed of a high, low, and middle band that are calculated using an error adjusted adaptive filter algorithm that utilizes dimension as the smoothing constant modulator.
The basis filter for the error bands has two calculation types built in:
-> MA - Calculates the filters as adaptive moving averages modulated by D.
-> WAP - Calculates the filters as adaptive weighted average prices modulated by D.
The WAP starting point can be based on the High Dimension Zone being moved or a user defined interval.
You can also define the WAP's minimum and maximum periods for additional control of the initial and decayed sensitivity states.
The alpha (smoothing constant) modulator can be fine tuned using the designated dimension thresholds.
When D is at or below the low dimension threshold, the filter is most responsive, and vice-versa for the high dimension threshold.
Alpha is then multiplied by a user defined amount for additional control of sensitivity.
Band width is then multiplied by a user defined value.
A Hull transformation can be optionally performed on the zone averaging and band filter algorithms as well, which will alter the frequency and phase responses at the cost of some overshoot.
This transformation is the same as a typical Hull equation, but with custom filters being used instead of WMA.
The calculated outputs are then used to gauge the trend for signal and color scheme calculations.
First, a dominant trend indication is selected from its designated dropdown tab.
The available built in indications to choose from are:
-> Band Trend (Outer) - Detects band breakouts and saves their direction to gauge trend.
-> Band Trend (Median) - Uses disparity between source and the band median to gauge trend.
-> Zone Trend (Expansion) - Detects when the high fractal zone expands and saves its direction to gauge trend.
-> Zone Trend (Outer Levels) - Detects zone breakouts and saves their direction to gauge trend.
-> Zone Trend (Median) - Uses disparity between source and the zone median to gauge trend.
Then the trend output is optionally filtered before triggering signals.
There are multiple trend filtration options built into this script that can be used individually or in unison:
-> Filter Trend With High Fractal Zone - Filters the trend using the specified zone level or combination of levels with either disparity or crossover conditions.
There is a set of options for bullish and bearish trends.
-> Filter Trend With Error Bands - Filters the trend using the specified band level or combination of levels with either disparity or crossover conditions.
There is a set of options for bullish and bearish trends.
-> Filter Trend With Band - Zone Disparity Condition - Filters the trend using the specified band level, zone level, and disparity direction.
There is a set of options for bullish and bearish trends.
-> Filter By Zone That Moves With The Trend - Filters the specified trend by detecting when the high fractal zone’s direction correlates.
-> Filter By Bands That Move With The Trend - Filters the specified trend by detecting when the error bands’ direction correlates.
-> Filter Using Wave Confirmation - Filters the specified trend by detecting when source is in a correlating wave with user defined length.
You can also choose separate lengths for bullish and bearish trends.
-> Filter By Bars With Decreasing Dimension - Filters the specified trend by detecting when fractal dimension is decreasing, suggesting source is approaching more linear movement.
The filtered trend output is then used to generate entry and exit signals.
There are multiple options included to fine tune how these signals behave.
For entries, you have the following options built in:
-> Limit Entry Dimension - Limits the range of dimensional values that are acceptable for entry with user defined thresholds.
This can be incredibly useful for filtering out entries taken when price is moving in a more complex pattern,
or when price is approaching a peak and you’re a little late to the party.
-> Enable Position Increase Signals - Enables more entry signals to fire up to a user defined number of times when a position is active.
This is helpful for those who incrementally increase their positions, or for those who want to see additional signals as reference.
-> Limit Number Of Consecutive Trades - Limits the number of consecutive trades that can be opened in a single direction to a user defined maximum.
This is especially useful for markets that only trend for brief durations.
By limiting the amount of trades you take in one direction, you have more control over your market exposure.
There is a set of these options for both bullish and bearish entries.
For exits, you have the following options built in:
-> Include Exit Signals From High Fractal Zone - Enables exit signals generated from either crossover or disparity conditions between price and a specified zone level.
-> Include Exit Signals From Error Bands - Enables exit signals generated from either crossover or disparity conditions between price and a specified zone level.
-> Include Inactive Trend Output For Exits - Triggers exit signals when the filtered trend output is an inactive value.
-> Dimension Target Exit Method - Triggers exit signals based on fractal dimension hitting a user defined threshold.
You can either choose for the exit to trigger instantly, or after dimension reverts from the target by a user specified amount.
-> Exit At Maximum Entry Dimension - Triggers exit signals when dimension exceeds the maximum entry limit.
-> Number Of Signals Required For 100% Exit - Controls the number of exit signals required to close the position.
You can also choose whether or not to include partial exits.
Enabling them will fire a partial signal when an exit occurs, but the position is not 100% closed.
Of course, there is a set of these options for bullish and bearish exits.
In my opinion, no system is complete without some sort of risk management protocol in place.
So in this script, bullish and bearish trades come equipped with optional protective SL and TP levels with signals.
The levels can be fixed or trailing, and are calculated with a user defined scale.
The available scales for SL and TP distances are ticks, pips, points, % of price, ATR, band range, zone range, or absolute numerical value.
Now what if you have some awesome signals of your own that you’d like to use in conjunction with this script?
Well good news. You can!
In addition to all of the customizable features built into the script, you can integrate your own signals into the system using the external data inputs and linking your script.
This adds a whole new layer of customization to the system.
With external signals, you can use your own custom dominant trend indication, filter the dominant trend, and trigger exits and protective stops using custom signals.
The signal input is an integer format. 1=Bull Signal, -1=Bear Signal, 2=Bull Exit, -2=Bear Exit, 3=Bull SL Hit, -3=Bear SL Hit, 4=Bull TP Hit, -4=Bear TP Hit.
You can also use the external input as a custom source value for either dimension or global sources to further tailor the system to your liking.
The color scheme in this script utilizes two custom gradients that can be chosen for bar and background colors:
-> Trend (Dominant or Filtered) - A polarized gradient that shows green scaled values for bullish trend and red scaled values for bearish trend.
The colors are brighter and more vibrant as perceived trend strength increases.
-> Dimension - A thermal gradient that shows cooler colors when dimension is higher, and hotter colors when dimension is lower.
Both color schemes are dependent on the designated dimension thresholds.
The script comes equipped with alerts for entries, additional entries, exits, partial exits, and protective stops so you can automate more and stare at your charts less.
And lastly, the script comes equipped with additional external outputs to further your analysis:
-> Entry And Exit Signals - Outputs in the same format as the external signal input with these additions: 5=Bull Increase, -5=Bear Increase, 6=Bull Reduce, -6=Bear Reduce.
You can use these to send to other scripts, including strategy types so you can backtest your performance on TV’s engine.
-> Dominant Trend - Outputs 1 for bullish and -1 for bearish. Can be used to send trend signals to another script.
I designed this tool with individuality in mind.
Every trader has a different situation. We trade on different schedules, markets, perspectives, etc.
Analytical systems of basically any type are very seldom (if ever) “one size fits all” and usually require a fair amount of modification to achieve desirable results.
That’s why this system is so freely customizable.
Your system should be flexible enough to be tailored to your analytical style, not the other way around.
When a system is limited in what you can control, it limits your experience, analytical potential, and possibly even profitability.
This is not your typical pre-set system. If you're looking for just another "buy, sell" script that requires minimal thought, look elsewhere.
If you’re ready to dive into a powerful technical system that allows you to tailor the experience to your style, welcome!
-----------------------------------------------------------------------------------------------------------------------------------------------------------------
This is a premium script, and access is granted on an invite-only basis.
To gain access, get a copy of the system overview, or for additional inquiries, send me a direct message.
I look forward to hearing from you!
-----------------------------------------------------------------------------------------------------------------------------------------------------------------
General Disclaimer:
Trading stocks, futures, Forex, options, ETFs, cryptocurrencies or any other financial instrument has large potential rewards, but also large potential risk.
You must be aware of the risks and be willing to accept them in order to invest in stocks, futures, Forex, options, ETFs or cryptocurrencies.
Don’t trade with money you can’t afford to lose.
This is neither a solicitation nor an offer to Buy/Sell stocks, futures, Forex, options, ETFs, cryptocurrencies or any other financial instrument.
No representation is being made that any account will or is likely to achieve profits or losses of any kind.
The past performance of any trading system or methodology is not necessarily indicative of future results.
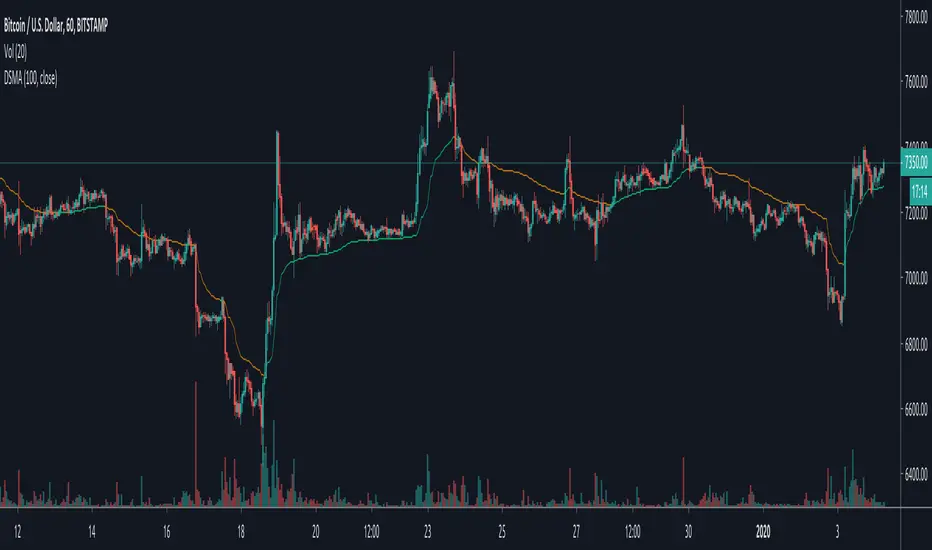
Ehlers Mother Of Adaptive Moving Averages [CC]The Mother Of Adaptive Moving Averages was created by John Ehlers (Rocket Science For Traders pgs 182-183) and this is definitely my favorite Ehlers moving average script. This works as a trend indicator and a typical moving average. When the mama is above the fama then the stock is in an uptrend and vice versa. Of course it is also good when the price is above the fama and mama lines. Buy when the indicator line is green and sell when it is red.
Let me know if there are other indicator scripts you would like to see me publish or if you want something custom done!

Vertical Horizontal Moving Average [AneoPsy & alexgrover] Moving average adapting to the strength of the trend, this is made possible by using the square of the vertical-horizontal filter as a smoothing factor. Alerts are included with two different types of conditions available to the user.
Settings
Length : Period of the moving average
Src : Input data for the indicator
Alerts : Types of conditions to be used in the alerts, when set to "VHMA Direction Change" alerts are triggered once the VHMA is either rising or declining, else the alerts are based on the crosses between Src and the VHMA
Usage
The VHMA can be used as a fast or slow-moving average in a moving average crossover system, or as input for other indicators.
VHMA of with length = 25 and sma with length = 200.
VHMA with length = 25 used as input for the RSI with length = 14.
Details
The vertical-horizontal filter is a measure of the strength of the trend and lay in a (0,1) range, to calculate it you just need to divide the rolling range over with the rolling sum of the absolute price changes, squaring the result allow to get lower results with higher values of length .
Squared vertical horizontal filter with length = 50, the value is low when the market is ranging and high when trending.
To set the alerts go in the alert panel, click on create alert, and select VHMA in "condition", choose between the buy or sell alert. If Src = closing price or another indicator dependant on the closing price select in options "once per bar close", if the indicator using the opening or lagged closing prices values as input select "One per bar" instead.
Thanks
Thanks to AneoPsy for adding the color change, the idea to use two kinds of conditions for the alert, and for its feedback, you can follow him
www.tradingview.com
and finally thanks to you for reading and for your support, only one last script left for the month, then we'll start July with some pretty interesting indicators, I hope you'll like them ^^/

The V_Wave: Volatility Adaptive Moving AverageThis is work in progress - but i wanted to see if there's interest to use or test it - or if someone finds it useful. there's already a crowd of great moving averages out there :)
This is a different type of zero-lag weighted moving average - and it's a concept that i have been working on for a while now. Given that this is WIP, i decided to keep the code protected for now.
The idea is to create a moving average that responds faster to the changes in the underlying data - which is the case with other zero-lag moving averages - but in this case, i also wanted to make it adaptive, so it accelerate when the volatility increases and at the same time, maintain limited lag and reasonable smoothing, even at longer length.
How Does it Compare to other MA's
==============================
in the chart, we can see a comparison between the V_Wave (thick yellow line) and the 3 common MAs, Hull Moving Average (HMA, aqua), a Weighted Moving Average (WMA, brown) and an Exponential Moving Average (EMA, grey)
the most important advantage in V_Wave, is because of the way the algorithm works, and that it maintains direct association with the underlying data and the given length, the V_Wave will have less overshoot when compared to other moving averages - i.e, it stays closer to the underlying data points at times of quick reversals or big changes - like the V reversal on the right of the chart. You can also test it against other MAs you may be already using and share your findings back with me.
settings:
=========
- the settings provide the ability to choose the source data (close vs hl2, ..etc), the length, and the ability to adjust the "aggressiveness" of the line (Accelerator) ..
- this accelerator is the factor that tells the V_Wave how fast to respond to the volatility changes. when you increase the accelerator, the V_Wave is more aggressive, and will respond faster to changes in volatility -- it becomes more responsive to changes in the trend, but that will sacrifice the smoothness of the line.
- i capped this value to 7, because beyond that, the accelerator will have a diminished effect.
- Also note that due to association with volatility, the V_Wave will behave differently at lower time frames -- and becomes closer to an EMA but better (in responsiveness) than a WMA.
- the smoothing is built-in for now, and will adjust based on the length, in a way similar to how HMA smoothing works (see my previous post on Evolving the Zero Lag MA for details on that) - in future versions, i may make it a manual entry or a selection between manual/automatic
Usage:
=======
Use the V_Wave as you use other moving averages - once you get to know how it behaves and adapts to underlying data changes.
you can use it as a filter to generate signals once it crosses other MAs, or another V_Wave of a different length / acceleration.
will be great if you share your test results and your use cases to help me improve how the V_Wave works.
best of luck!

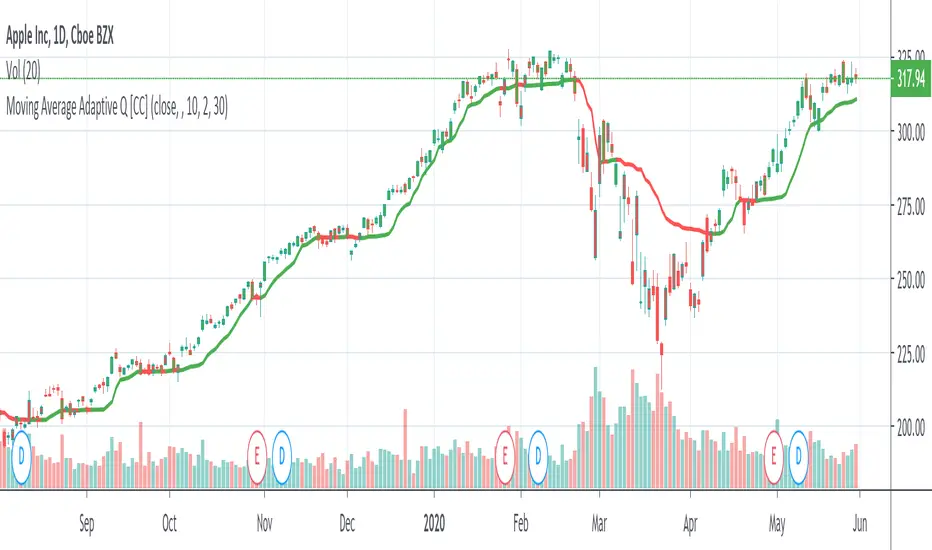
Moving Average Adaptive QThe Moving Average Adaptive Q (MAAQ) was authored by Perry Kaufman in the Stocks and Commodities Magazine 06/1995
This is similar to his Kaufman Adaptive Moving Average with a few changes. This is a pretty close moving average which I like quite a bit. Try it and let me know what you think.
Send me a message and let me know what other indicators you would like to see!
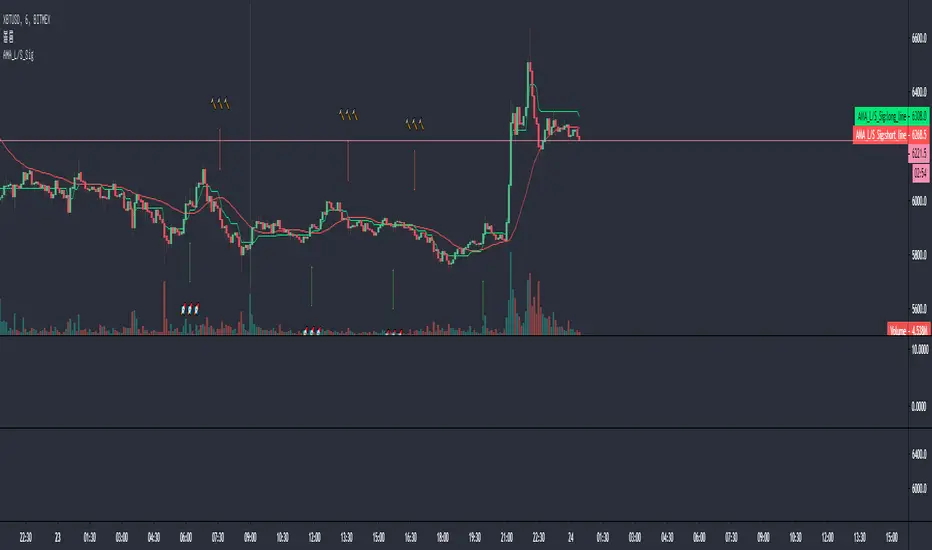
AMA_L/S_Sig- Fast EMA, Slow EMA Cross Strategy
- Use AMA for Slow
- Fast is expressed in some smoothing ways
- Hyper parameters not tuned
- For reference purposes
Minkowski Distance Factor Adaptive Period MACDHi, this script comes from the idea that Ricardo Santos' Minkovski Distance Function is transferred to the period as a factor.
Minkowski distance is used as a percentage factor with the help of Relative Strength Index function.
Minkowski Distance Function Script :
And thus an adaptive MACD was created.
This script can give much better results in more optimized larger periods.
I leave the decision to determine the periods and weights.
I used the weights of 9,12,26 and periods created with multiplied by factor.
Regards.

Deviation Scaled Moving Average [ChuckBanger]This is a deviation scaled moving average original designed by John Ehlers. It is a new adaptive moving average that has the ability to rapidly adapt to volatility in price movement with minimal lag. Because it is so smooth and adapts to the volatility of the market it is by far a really great tool for spotting trend changes
MTF IQ IFM Moving AverageMTF ready adaptive MA using Ehler's IQ IFM ( In Phase - Quadrature Instantaneous Frequency Measurement ).
Ehler's formula is a method of quantitatively measuring the length of a market cycle. In this case it is used to calculate the "optimal" adaptive EMA.
Theoretically the length generated by Ehler's formula could be used in many indicators and it's been placed within it's own function so you should be able to simply copy/paste it. HOWEVER pine will not accept series variables for the length input used in built-in functions. You will have to manually code (or find) a version of your indicator that doesn't use the pine built in.
Options :
type : optionally add volume weighting
range : historical range used in IQ IFM
cycle length mult : method to create faster/slower MAs. eg 0.5 is half the length of a cycle and a faster EMA ie EMA10 vs EMA20
low sat fix : some cryptocurrencies with low satoshi values cause an issue with the calculation, if you get no/nonsensical lines, enable this. Shouldn't affect other instruments, but can be disabled just in case.
MTF options: run the calculation on an alternative timeframe
--------------------------------------
If you find it useful please consider a tip/donation :
BTC - 3BMEXEDyWJ58eXUEALYPadbn1wwWKmf6sA

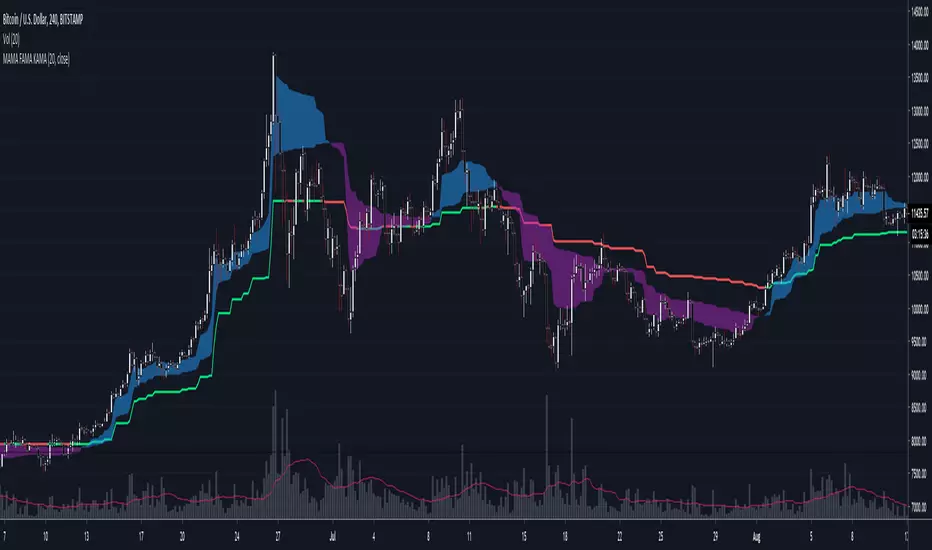
MAMA FAMA KAMA.. chameleon 🎵
Uses Kaufmann's Efficiency Ratio to generate adaptive inputs for Ehler's MAMA/FAMA. Alphas from the Hilbert transform are then used in place for the KAMA calculation.
Original MAMA/FAMA by everget : link
--------------------------------------
If you find it useful please consider a tip/donation :
BTC - 3BMEXEDyWJ58eXUEALYPadbn1wwWKmf6sA
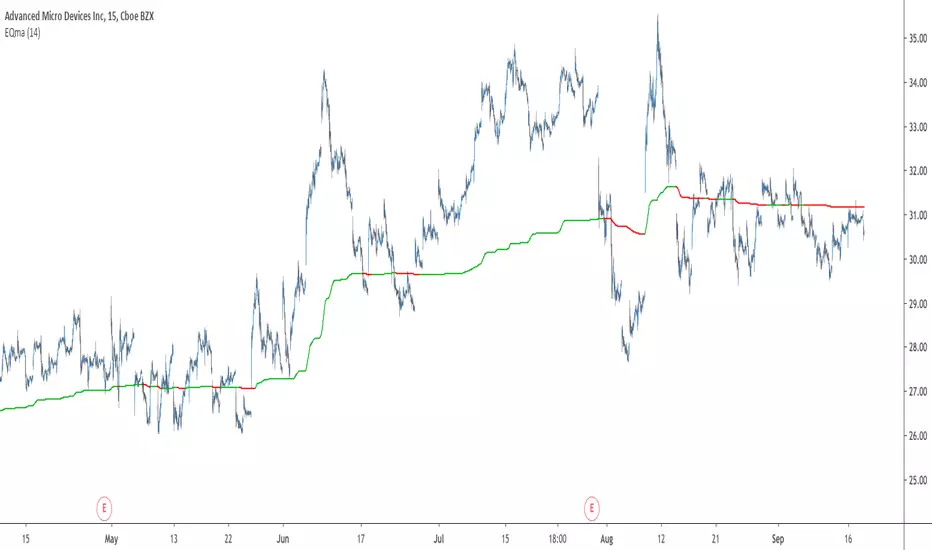
EQma - Adaptive Smoothing Based On Optimal Markets DetectionIntroduction
"You don’t put sunscreen when there is no sun, you don’t use an umbrella when there is no rain, you don’t use a kite when there is no wind, so why would you use a trend following strategy when there is no trend ?"
This is how i start my 4th paper "A New Technical Indicator For Optimal Markets Detection" where i present two new technical indicators. We talked about the first one, running equity, which aim to detect the best moment to enter trades, based on this new metric i made an adaptive moving average.
You can see the full paper here figshare.com
The Indicator
The moving average is based on exponential averaging and use a smoothing variable alpha based on the running equity metric, in order to calculate alpha the running equity is divided by the optimal equity which show the best returns possible for the conditions used. Basically the indicator work as follow :
When the running equity is close to the optimal equity it means that the price need no/little filtering since it does not contain information that need to be filtered, therefore alpha is high, however when the running equity is far from the optimal equity this mean that the price posses malign information that need to be removed.
This is why the indicator will be closer to the price when length is high :
See the full paper for an explanation on how this work.
I added various options for the indicator, one will reduce the lag by squaring alpha, thus giving for length = 14 :
The efficient option will make use of recursion to provide a more efficient indicator :
In green the efficient version, note how this option can allow a better fit with the price.
Conclusion
This is an indicator but at its core its rather a framework, if you have read the paper you'll see that the conditions are just 1 and -1 that changes with time, basically its like making a strategy with :
Condition = if buy then 1 else if sell then -1 else Precedent value of condition.
So those two indicators allow to give useful and usable information about your strategy. I hope it can be of use for anyone here, if so don't hesitate to send me what you made using the proposed indicator (and with all my indicators in general). If you are writing a paper and you think this indicator could fit in your work then let me know so i can be aware of it :)
Thanks for reading !
Acknowledgement
My papers are quite ridiculous but they still manage to get some views, some researchers don't even reach those number in so little time which is quite unfortunate but also really motivating for me, so thanks to those who take time to read them and give me some feedback :)
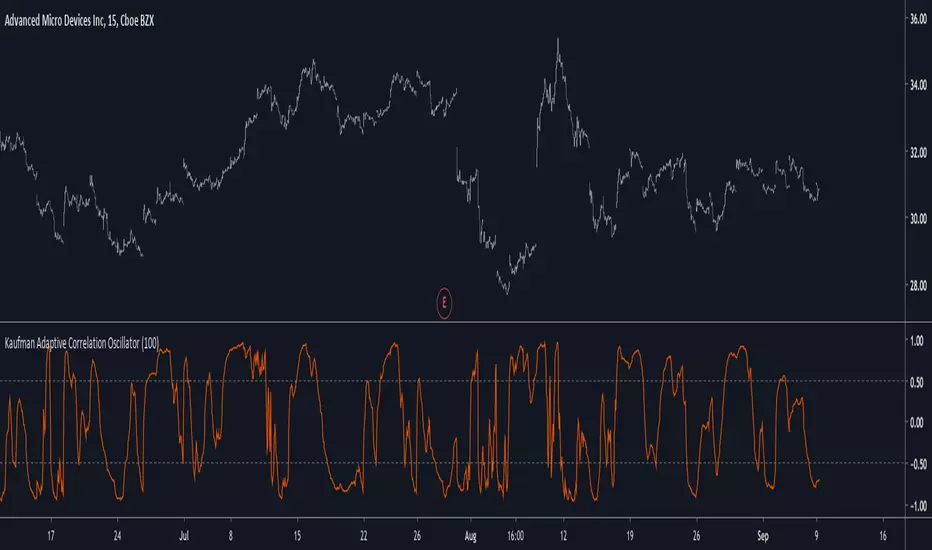
Kaufman Adaptive Correlation OscillatorIntroduction
The correlation oscillator is a technical indicator that measure the linear relationship between the market closing price and a simple increasing line, the indicator is in a (-1,1) range and rise when price is up-trending and fall when price is down-trending. Another characteristic of the indicator is its inherent smoothing which provide a noise free (to some extent) oscillator.
Such indicator use simple moving averages as well as estimates of the standard deviation for its calculation, but we can easily make it adaptive, this is why i propose this new technical indicator that create an adaptive correlation oscillator based on the Kaufman adaptive moving average.
The Indicator
The length parameter control the period window of the moving average, larger periods return smoother results while having a low kurtosis, which mean that values will remain around 1 or -1 a longer period of time. Pre-filtering apply a Kaufman adaptive moving average to the input, which allow for a smoother output.
No pre-filtering in orange, pre-filtering in yellow, period = 100 for both oscillators.
If you are not aware of the Kaufman adaptive moving average, such moving average return more reactive results when price is trending and smoother results when price is ranging, this also apply for the proposed indicator.
Conclusion
Classical correlation coefficients could use this approach, therefore the linear relationships between any variables could be measured. The fact that the indicator is adaptive add a certain potential, however such combination make the indicator have the drawback of kama + the correlation oscillator, which might appear at certain points.
Thanks for reading !
[CS] AMA Strategy - Channel Break-Out"There are various ways to detect trends with moving averages. The moving average is a rolling filter and uptrends are detected when either the price is above the moving average or when the moving average’s slope is positive.
Given that an SMA can be well approximated by a constant-α AMA, it makes a lot of sense to adopt the AMA as the principal representative of this family of indicators. Not only it is potentially flexible in the definition of its effective lookback but it is also recursive. The ability to compute indicators recursively is a very big positive in latency-sensitive applications like high-frequency trading and market-making. From the definition of the AMA, it is easy to derive that AMA > 0 if P(i) > AMA(i-1). This means that the position of the price relative to an AMA dictates its slope and provides a way to determine whether the market is in an uptrend or a downtrend."
You can find this and other very efficient strategies from the same author here:
www.amazon.com
In the following repository you can find this system implemented in lisp:
github.com
To formalize, define the upside and downside deviations as the same sensitivity moving averages of relative price appreciations and depreciations
from one observation to another:
D+(0) = 0 D+(t) = α(t − 1)max((P(t) − P(t − 1))/P(t − 1)) , 0) + (1 − α(t − 1))D+(t − 1)
D−(0) = 0 D−(t) = −α(t − 1)min((P(t) − P(t − 1))/P(t − 1)) , 0)+ (1 − α(t − 1))D−(t − 1)
The AMA is computed by
AMA(0) = P(0) AMA(t) = α(t − 1)P(t) + (1 − α(t − 1))AMA(t − 1)
And the channels
H(t) = (1 + βH(t − 1))AMA(t) L(t) = (1 − βL(t − 1))AMA(t)
For a scale constant β, the upper and lower channels are defined to be
βH(t) = β D− βL(t) = β D+
The signal-to-noise ratio calculations are state dependent:
SNR(t) = ((P(t) − AMA(t − 1))/AMA(t − 1)) / β D−(t) IfP(t) > H(t)
SNR(t) = −((P(t) − AMA(t − 1))/AMA(t − 1)) / β D−(t) IfP(t) < L(t)
SNR(t) = 0 otherwise.
Finally the overall sensitivity α(t) is determined via the following func-
tion of SNR(t):
α(t) = αmin + (αmax − αmin) ∗ Arctan(γ SNR(t))
Note: I added a moving average to α(t) that could add some lag. You can optimize the indicator by eventually removing it from the computation.

ACAT (450-600 Hi-Res) [acatwithcharts]Adaptive Comprehensive Average Tracker is a 2 in 1 version of Mean Reversion MA and Compression MA. The slightly odd name is a backronym that spells "ACAT" - suffice it to say, I'm pretty proud of what these two indicators have developed into.
This is 4 of 4 in a series of Hi-Res indicators from 14-600 that are intended to be used in concert weaved together. Some of the default display settings are slightly tweaked to account for the assumption that they would not be used by themselves individual. The labels are intended to weave with the other instances of ACAT, which is very obviously not something that was designed for in the v4 labeling code and works about as passably well as I could get it, noting that coming up with a method for setting variable distances that always looks sharp across instruments and timeframes is near-impossible.
Compared to what subscribers will be used to from using standard resolution ACAT, this should greatly sharpen the borders of the compression bands in particular. A key caveat to be aware of is that dividing the range into multiple instances like this means that there can be tracking of several distributions at the same time if different indicators are triggering independently after being reset on different ranges - which in some cases means more relevant periods are being identified but often times can mean a mess of information with some less important periods being overlaid as if they were of equal importance to the longest period lengths.
My volatility indicators are available by subscription in several packages through SharkCharts.live - and this is planned to be the first new one ready to add. I plan to on totally overhauling my explanation videos on ACAT since the indicator just does so much more than it used to when the previous videos were recorded, but as of the time of this writing the videos on Mean Reversion MA, Compression MA, and my livestream with DadShark do cover most parts of it. These videos and videos on my other indicators are currently hosted on DadShark's YouTube channel.
Current pricing and subscription details will be kept up-to-date on SharkCharts.live

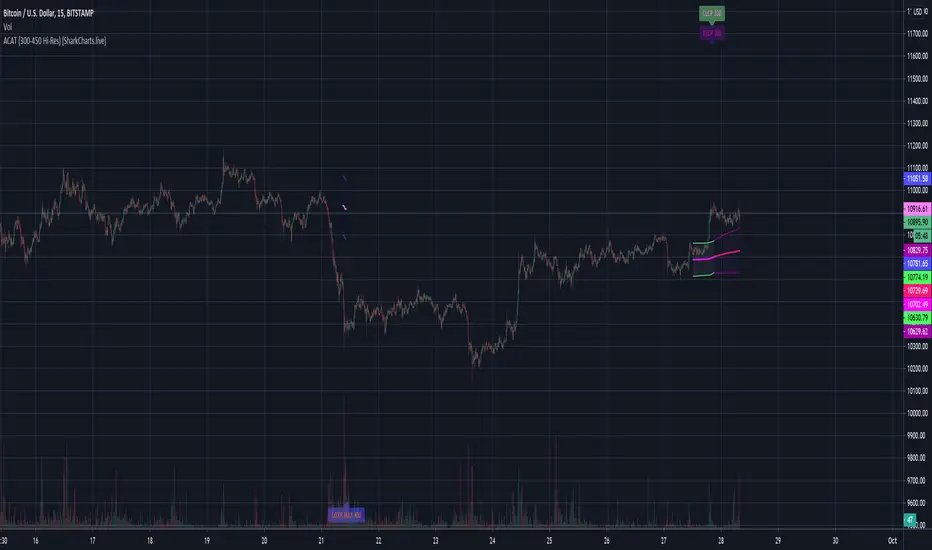
ACAT (300-450 Hi-Res) [acatwithcharts]Adaptive Comprehensive Average Tracker is a 2 in 1 version of Mean Reversion MA and Compression MA. The slightly odd name is a backronym that spells "ACAT" - suffice it to say, I'm pretty proud of what these two indicators have developed into.
This is 3 of 4 in a series of Hi-Res indicators from 14-600 that are intended to be used in concert weaved together. Some of the default display settings are slightly tweaked to account for the assumption that they would not be used by themselves individual. The labels are intended to weave with the other instances of ACAT, which is very obviously not something that was designed for in the v4 labeling code and works about as passably well as I could get it, noting that coming up with a method for setting variable distances that always looks sharp across instruments and timeframes is near-impossible.
Compared to what subscribers will be used to from using standard resolution ACAT, this should greatly sharpen the borders of the compression bands in particular. A key caveat to be aware of is that dividing the range into multiple instances like this means that there can be tracking of several distributions at the same time if different indicators are triggering independently after being reset on different ranges - which in some cases means more relevant periods are being identified but often times can mean a mess of information with some less important periods being overlaid as if they were of equal importance to the longest period lengths.
My volatility indicators are available by subscription in several packages through SharkCharts.live - and this is planned to be the first new one ready to add. I plan to on totally overhauling my explanation videos on ACAT since the indicator just does so much more than it used to when the previous videos were recorded, but as of the time of this writing the videos on Mean Reversion MA, Compression MA, and my livestream with DadShark do cover most parts of it. These videos and videos on my other indicators are currently hosted on DadShark's YouTube channel.
Current pricing and subscription details will be kept up-to-date on SharkCharts.live
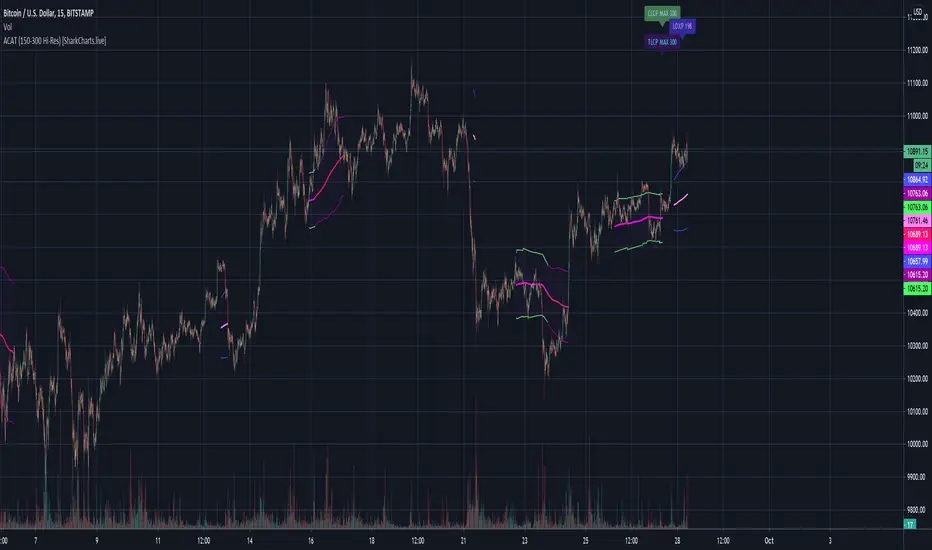
ACAT (150-300 Hi-Res) [acatwithcharts]Adaptive Comprehensive Average Tracker is a 2 in 1 version of Mean Reversion MA and Compression MA. The slightly odd name is a backronym that spells "ACAT" - suffice it to say, I'm pretty proud of what these two indicators have developed into.
This is 2 of 4 in a series of Hi-Res indicators from 14-600 that are intended to be used in concert weaved together. Some of the default display settings are slightly tweaked to account for the assumption that they would not be used by themselves individual. The labels are intended to weave with the other instances of ACAT, which is very obviously not something that was designed for in the v4 labeling code and works about as passably well as I could get it, noting that coming up with a method for setting variable distances that always looks sharp across instruments and timeframes is near-impossible.
Compared to what subscribers will be used to from using standard resolution ACAT, this should greatly sharpen the borders of the compression bands in particular. A key caveat to be aware of is that dividing the range into multiple instances like this means that there can be tracking of several distributions at the same time if different indicators are triggering independently after being reset on different ranges - which in some cases means more relevant periods are being identified but often times can mean a mess of information with some less important periods being overlaid as if they were of equal importance to the longest period lengths.
My volatility indicators are available by subscription in several packages through SharkCharts.live - and this is planned to be the first new one ready to add. I plan to on totally overhauling my explanation videos on ACAT since the indicator just does so much more than it used to when the previous videos were recorded, but as of the time of this writing the videos on Mean Reversion MA, Compression MA, and my livestream with DadShark do cover most parts of it. These videos and videos on my other indicators are currently hosted on DadShark's YouTube channel.
Current pricing and subscription details will be kept up-to-date on SharkCharts.live
ACAT (14-150 Hi-Res) [acatwithcharts]Adaptive Comprehensive Average Tracker is a 2 in 1 version of Mean Reversion MA and Compression MA. The slightly odd name is a backronym that spells "ACAT" - suffice it to say, I'm pretty proud of what these two indicators have developed into.
This is 1 of 4 in a series of Hi-Res indicators from 14-600 that are intended to be used in concert weaved together. Some of the default display settings are slightly tweaked to account for the assumption that they would not be used by themselves individual. The labels are intended to weave with the other instances of ACAT, which is very obviously not something that was designed for in the v4 labeling code and works about as passably well as I could get it, noting that coming up with a method for setting variable distances that always looks sharp across instruments and timeframes is near-impossible.
Compared to what subscribers will be used to from using standard resolution ACAT, this should greatly sharpen the borders of the compression bands in particular. A key caveat to be aware of is that dividing the range into multiple instances like this means that there can be tracking of several distributions at the same time if different indicators are triggering independently after being reset on different ranges - which in some cases means more relevant periods are being identified but often times can mean a mess of information with some less important periods being overlaid as if they were of equal importance to the longest period lengths.
My volatility indicators are available by subscription in several packages through SharkCharts.live - and this is planned to be the first new one ready to add. I plan to on totally overhauling my explanation videos on ACAT since the indicator just does so much more than it used to when the previous videos were recorded, but as of the time of this writing the videos on Mean Reversion MA, Compression MA, and my livestream with DadShark do cover most parts of it. These videos and videos on my other indicators are currently hosted on DadShark's YouTube channel.
Current pricing and subscription details will be kept up-to-date on SharkCharts.live

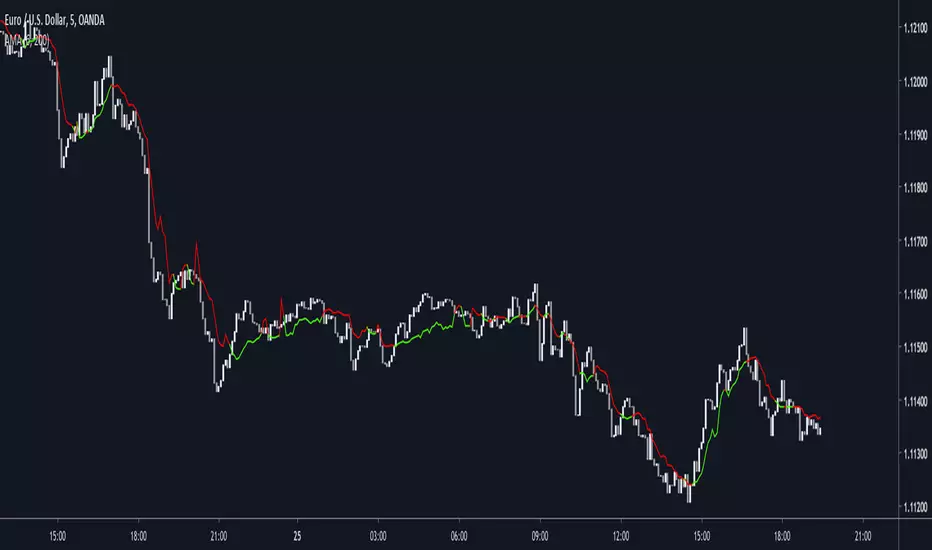
Dynamically Adjustable Moving AverageIntroduction
The Dynamically Adjustable Moving Average (AMA) is an adaptive moving average proposed by Jacinta Chan Phooi M’ng (1) originally provided to forecast Asian Tiger's futures markets. AMA adjust to market condition in order to avoid whipsaw trades as well as entering the trending market earlier. This moving average showed better results than classical methods (SMA20, EMA20, MAC, MACD, KAMA, OptSMA) using a classical crossover/under strategy in Asian Tiger's futures from 2014 to 2015.
Dynamically Adjustable Moving Average
AMA adjust to market condition using a non-exponential method, which in itself is not common, AMA is described as follow :
1/v * sum(close,v)
where v = σ/√σ
σ is the price standard deviation.
v is defined as the Efficacy Ratio (not be confounded with the Efficiency Ratio) . As you can see v determine the moving average period, you could resume the formula in pine with sma(close,v) but in pine its not possible to use the function sma with variables for length, however you can derive sma using cumulation.
sma ≈ d/length where d = c - c_length and c = cum(close)
So a moving average can be expressed as the difference of the cumulated price by the cumulated price length period back, this difference is then divided by length. The length period of the indicator should be short since rounded version of v tend to become less variables thus providing less adaptive results.
AMA in Forex Market
In 2014/2015 Major Forex currencies where more persistent than Asian Tiger's Futures (2) , also most traded currency pairs tend to have a strong long-term positive autocorrelation so AMA could have in theory provided good results if we only focus on the long term dependency. AMA has been tested with ASEAN-5 Currencies (3) and still showed good results, however forex is still a tricky market, also there is zero proof that switching to a long term moving average during ranging market avoid whipsaw trades (if you have a paper who prove it please pm me) .
Conclusion
An interesting indicator, however the idea behind it is far from being optimal, so far most adaptive methods tend to focus more in adapting themselves to market complexity than volatility. An interesting approach would have been to determine the validity of a signal by checking the efficacy ratio at time t . Backtesting could be a good way to see if the indicator is still performing well.
References
(1) J.C.P. M’ng, Dynamically adjustable moving average (AMA’) technical
analysis indicator to forecast Asian Tigers’ futures markets, Physica A (2018),
doi.org
(2) www.researchgate.net
(3) www.ncbi.nlm.nih.gov
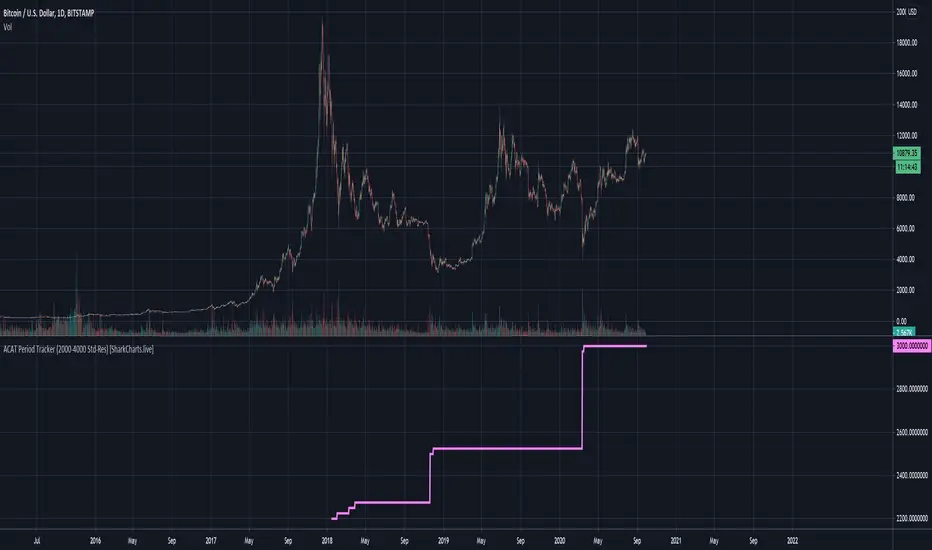
ACAT Period Tracker (2000-4000 Std-Res) [acatwithcharts]This is the corresponding period length tracker for ACAT (2000-4000 Std-Res). The constraints of Pinescript make it necessary to plot a separate indicator in a separate window to actually read out the period numbers without massively skewing the chart by default.
My volatility indicators are available by subscription in several packages through SharkCharts.live - and this is planned to be the first new one ready to add. I plan to release a video explaining how to use this indicator coinciding with launch, as there's a lot to talk about. Videos on my other indicators are currently hosted on DadShark's YouTube channel.
Current pricing and subscription details will be kept up-to-date on SharkCharts.live
ACAT (2000-4000 Std-Res) [acatwithcharts]Adaptive Comprehensive Average Tracker is a 2 in 1 version of Mean Reversion MA and Compression MA. The slightly odd name is a backronym that spells "ACAT" - suffice it to say, I'm pretty proud of what these two indicators have developed into.
The best solution I've managed to find to the variable count limits in Pinescript is to split the indicator into two that cover different ranges - and that aspect also theoretically allows for some other variations.
I've had difficulty increasing the resolution much without needing a huge number of individual indicators and running into constant Pinescript timeout issues. One thing that I can do, however, is extend the range further out.
Note that "Std-Res" here for this higher range was decided mostly based on, "What do I think I can get to work for higher than 2000 about as often as the existing 600-2000 indicator?" and is semi-arbitrary. At higher period lengths, the spread between different MAs decreases so less resolution is needed, while the calculation times increase dramatically, so this script is necessarily a lot less dense than the lower lengths. Sometimes this will load much faster as a result. I'm generally finding both struggle on shorter timeframes.
Keep in mind some caveats: resolution at these lengths is lower and finding relevant period lengths this far out necessarily means you should be trading them on higher timeframes. If you see something on the 3000 period on the 4h, you're talking about events happening near W benchmark length moving averages. If you see something in these periods lengths on the D timeframe as with some parabolic bubbles/crashes, you're looking at very macro pivots and targets happening near M benchmark length moving averages.
My volatility indicators are available by subscription in several packages through SharkCharts.live - and this is planned to be the first new one ready to add. I plan to release a video explaining how to use this indicator coinciding with launch, as there's a lot to talk about. Videos on my other indicators are currently hosted on DadShark's YouTube channel.
Current pricing and subscription details will be kept up-to-date on SharkCharts.live
