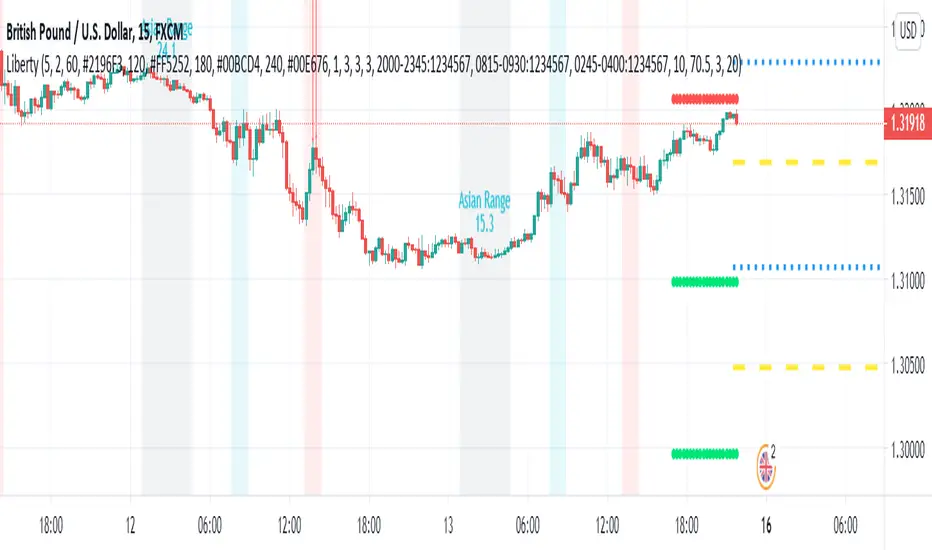
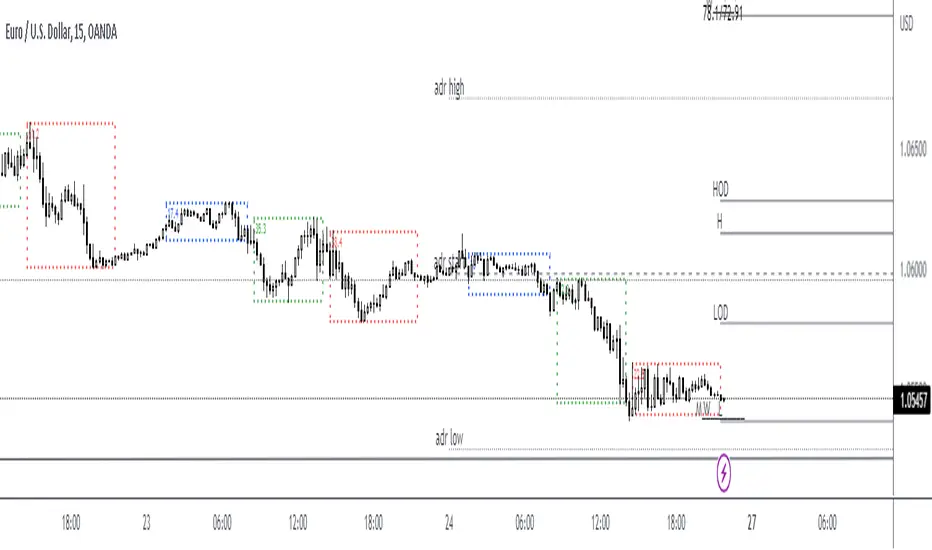
Liberty Scanner This indicator scans the market for New York session entries based on trend and fibs.
The indicator also detects killzones, which are basically supply and demand zones. We like to think of these as areas of which banks are placing their orders.
The indicator also gives you the Asian range and how many pips the market has moved for the Asian range, that is what determines whether we are in normal market conditions or not.
We also made it to where you can see yesterdays highs and lows, when you understand the market directions then you typically know which swing (high or low) will be broken.
The indicator also has an ADR (Average Day Range) feature where it calculates the "average" amount of pips the market moves per day based on the previous 3-10 days of the market volatility.
The main thing which gives us signal for entry is the New York session Fibonacci levels in which it automatically scans for the nearest 15 minute swing and it'll give you an entry based off of that.
*This indicator in no way is meant to be 100% accurate, please do your own analysis before placing any trades and trade with proper risk, as this market is extremely volatile and risky. Past profits don't guarantee future results*
FOR ACCESS: Please send us a private message to gain access to this indicator.
ADR
Average Daily RangeAverage Daily Range of a given period. Period is an adjustable input through setting's menu.
ADR Metrics/MatrixI didn't see any such idea around for ADR on TV, so decided to do one myself for doing some testing.
It's very simple logic, what we are seeing on the chart are ADR and its intraday ranges. These can be S/R, SL, targets, and entries for your trading decisions.
Here is an example
Please note that this is only for intraday. It's a small and clean code.
Past performance is not an assurance of future success. This idea is for educational purposes only.
Enjoy~

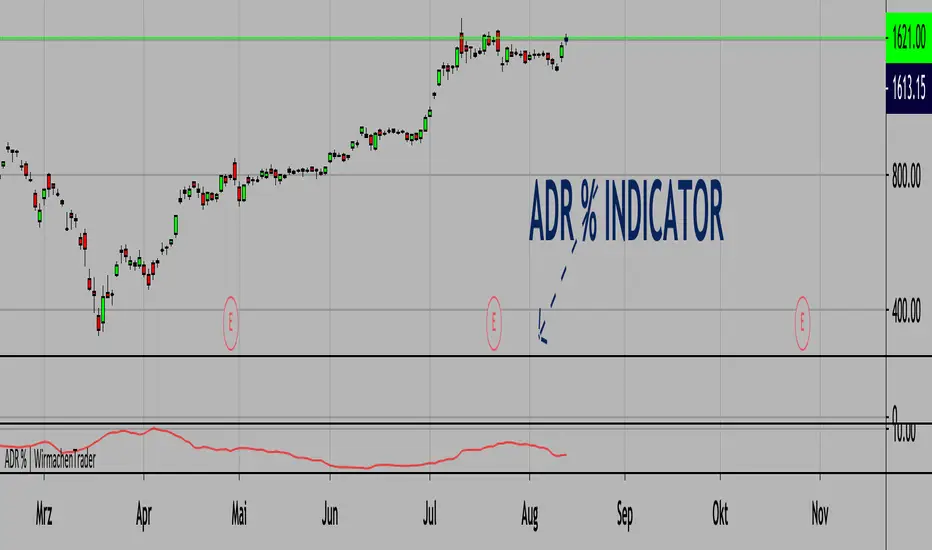
Average Daily Range % | Bigger relative range - better profits.(ENGLISH VERSION BELOW)
Die richtige Auswahl von Instrumenten ist essenziell. Wir können nur dann Profite machen, wenn das Instrument sich bewegt. Bekannte Indikatoren wie der ATR (Average True Range) inkludieren hier ebenfalls Kurslücken. Das ist gut, dennoch wollen wir Volatiltät von einem anderen Standpunkt betrachten. Welche Bewegungen sind also vom Hoch zum Tief möglich gewesen? Verständlicherweise können wir diesen Wert einer kleinen Aktie nicht mit TSLA vergleichen. Aus diesem Grund schauen wir uns die Relation zum Preis an. Somit können wir wirklich Äpfel mit Äpfel vergleichen. Je höher der Wert, desto mehr Range (basierend auf der 20 Tage-Historie und dem jeweiligen Preis). Natürlich funktioniert dieser Indikator auch in anderen Asset-Klassen wie Krypto, Forex etc.
Wichtig: Wende diesen Indikator im Tageschart an!
English version:
Stock selection is pretty important. We can only make decent profits if the underlying stock moves. Well-known indicators like the ATR (Average True Range) also include price gaps here. This is good, nevertheless, we want to look at volatility from another point of view. So, which movements were possible from high to low? Understandably, we cannot compare this value with TSLA for a small share. That's why we look at the relation to price.
The higher the value, the bigger the range (based on the 20-day history and the respective price).
Important: Use this indicator on a daily timeframe!
Cheers,
WirmachenTrader®
Market ExtremitiesHere I'm proposing an indicator to measure market extremities, it is different than usually used STDv function and has a much simpler underlying mechanism. However, what you will compromise by it is that it is not going to work efficiently like STDv and you will need to use some form of trend and momentum indicators along with it. Not efficiently doesn't mean not tradable, in fact, this is what I use over STEDv myself to reduce the noise of Bollinger Bands.
This indicator is only designed to catch the highs and lows of the market during intraday. It works across all markets and it is surprisingly good at it and has certain predictive nature since the price seems to hang around the extreme lines. Having said that, an astute trader can trade this for both breakouts and mean reversion strategies.
For reference here is one chart marked
This is for educational purpose only-
Past performance is no indicator of future success and author takes no responsibility for the trader's actions.
Enjoy~


Average Daily Range (ADR) with variable look back periodThis script allows the user to change the look back period with a default of 7 periods. Fixed stops and/or profit targets can lead to risk mismanagement during high or low volatility conditions. For a particular setup, a profit target could be say 15% of the ADR and the stop at 10% of the ADR. ADR is sometimes preferred over ATR (Average True Range) as the former doesn't include gaps

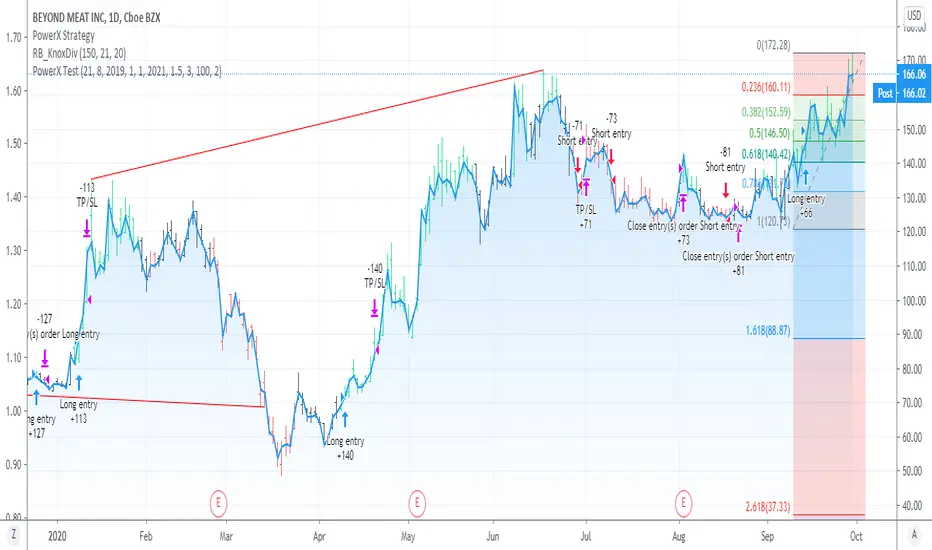
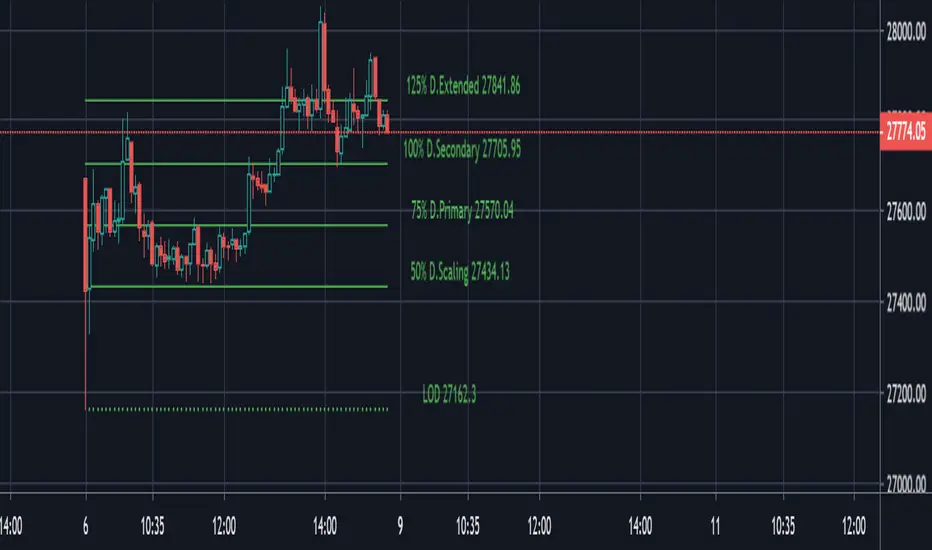
PivotBoss ADR Price TargetsThis script forcasts daily, weekly, Monthly targets well in advance so that you can position yourself accordingly. Script has four target levels such as 50% target level, 75% target level, 100% target level and 125% target level. You can scale out your position across these levels. Price has 80% potential to reach 1st target level, 70% potential to reach 2nd second target level and 50% potential to reach 3rd and 4th target level.
The script takes 10 period average daily range and high of the period to project the downside targets, 10 period ADR and low of the peiod to project upsdie target levels.
When the price is trades in the narrow range in the prior period then the potehtial to reach 125% target level increase by 90%.
This script is purely price based use it with other pivotBoss pivots and volume profile for confirmation of your bias
Current vs. Average price performance (daily and weekly)This indicator is to be used only by the values it gives back, don't use the lines .
In "current week days" choose number of days that already BEGAN this week (ex. on Wednesday type 3)
Green1 - Current Daily Range
Orange1 - Average Daily Range
Green2 - Current Weekly Range
Red1 - Average Weekly Range
Orange2 - Today's price movement compared to the average daily price movement (in percentage)
Red2 - This week price movement compared to the average weekly price movement (in percentage)
By these values you can check how price performed today and this week in comparison to the average daily and weekly values - you can check with some probability if the movement is already exhausted or price can do some more action.

Donchian Breakout StrategyThis strategy buys when the Donchian Channel is broken to the upside and uses the lower Donchian Channel line as a trailing stop. You can also choose to use a moving average as a filter to keep you out of trades that are counter trend.
You can also configure which dates you want to backtest, so you can see how this behaves over specific time frames and market cycles.

Average Daily Range Label by Theoris (ADR)This indy show Label of
* Last price
* Range of Low - High ( from Average daily range calculation )
* ADR (14 ) default period 14
* value of current range ( pip ) / Average daily range.
Example
now price is
1499.4
( 1486.959 - 1510.841 ) --- > This is range calculate from ADR for normal range.
ADR(14)
58/148.41
meaning use ADR period 14
today run 58 pips
from average 14 period is 148.41 pips
can change period to other normally I use 10 or 14
Timeframe to use default is Daily
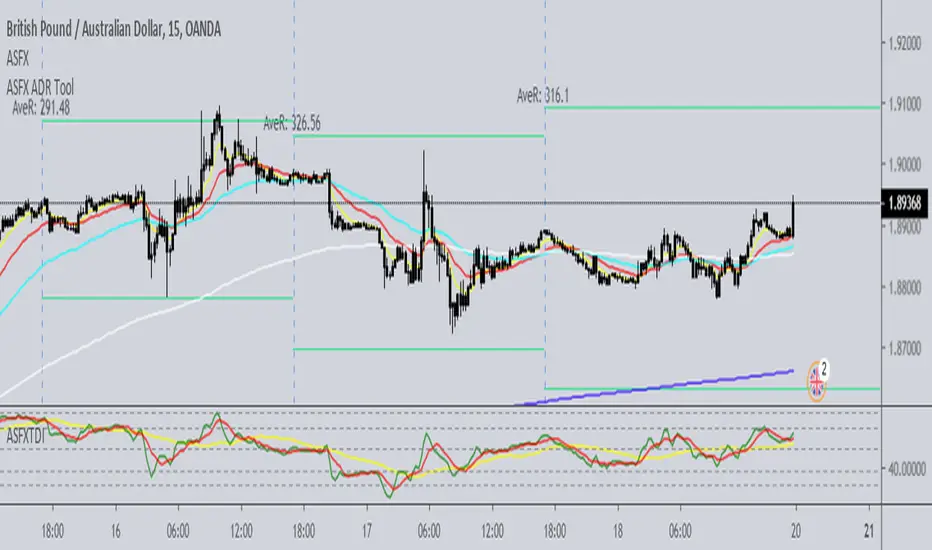
ASFX ADR ToolUsers cannot seem to find the original. This is a new publish at the request of Austin Silver, please enjoy!

Average Daily Range High LowThis version uses Pine Script v4 line objects which has a limit of 50 bars.
See www.tradingview.com


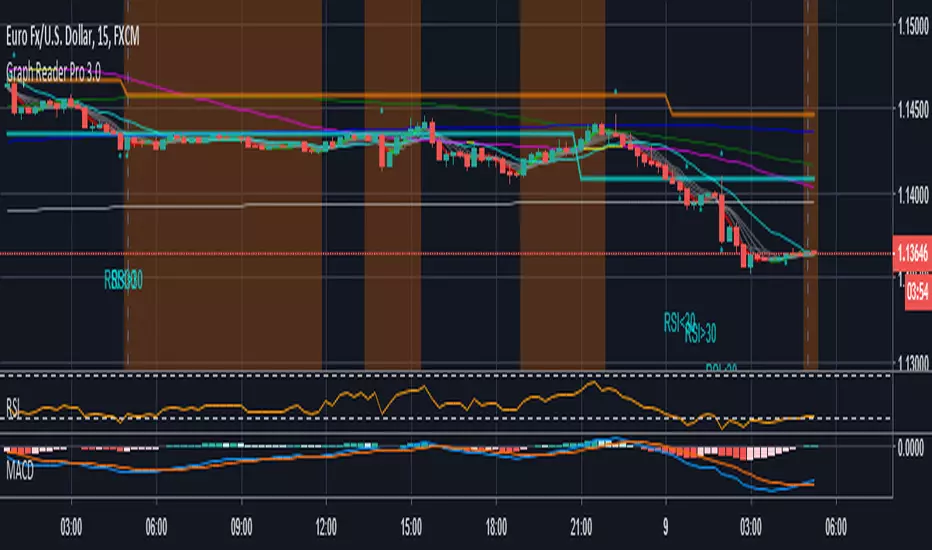
Graph Reader Pro 3.0Graph Reader Pro 3.0 for TradingView gives you abilities to see the stories hiding in the graphs of the stock, forex, and crypto currency markets. It counts CC59 and creates respectable support and resistance levels as well as marks and reminds you about important parameters that are happening in the graph so that you will not forget to consider them before placing orders. These parameters include:
Automatic CC59 counting that compares the close of the right price bar to that of left price bar in a group of 5 consecutive bars (ignoring 3 bars in the middle). If the right bar closed higher, the count positive number would be printed above the bar. If the right bar closed lower, the count negative number would be printed below the bar. Nine consecutive series of up counts will define the lowest price as CC59 support line and nine consecutive series of down counts will define the highest price as CC59 resistance line. The counted numbers, support and resistance lines are automatically printed on the graph if enabled.
Draw the high and low levels of the previous day, if enabled. The Previous Day's High and Low are often used as reversal levels in the few future days.
Draw the price range of each day based on Average Daily Range (ADR) value.
Draw the price range of each week based on Average Weekly Range (AWR) value.
Paint the background areas with active Forex trading of Asian, London, and New York sessions, if enabled.
Draw simple moving average lines such as SMA3, with ability to change the line color based on increasing or decreasing MACD value.
Draw simple moving average lines such as SMA50 with ability to change the line color based on increasing or decreasing prices. A set of other simple moving average lines such as SMA13, SMA200, SMA800 can be drawn if enabled.
Draw a ribbon of simple moving average lines consisting of SMA3, SMA4, SMA5, SMA6 and SMA7, if enabled. Twisting of the SMA ribbon gives a visual signal for price reversal.
Locate the price gaps in the graphs of stocks and indexes. The opened gaps are often closed later on. Hence, they are milestones for the price to come back and close them up.
Locate the pin bars having the body portion less than a specific percent of the range. The pin bars show hestitation for the price to continue the current trend. When a pin bar is covered or engulfed by the next larger bar, a trend reversal offen follows.
Automatic printing of the events happening in the graph to remind the readers of parameters under considerations (if enabled) including:
- Print "C>SMA3" and "C13" and "SMA5<13" for SMA(5) crossed above and below SMA(13).
- Print "Max" and "Min" for local maximum and local minimum bars.
- Print "RSI>70" and "RSI<70" for RSI(14) that crossed above 70 % and below 70 %.
- Print "RSI<30" and "RSI>30" for RSI(14) that crossed below 30 % and above 30 %.
- Print "RSI>50" and "RSI<50" for RSI(14) that crossed above 50 % and below 50 %.
- Print "RSI<50" and "RSI>50" for RSI(14) that crossed below 50 % and above 50 %.
- Print "MACD>0" and "MACD<0" for MACD(12,26,9) that crossed above and below zero.
- Print "MACD>Sig" and "MACD
Graph Reader Pro 2.0Graph Reader Pro 2.0 for TradingView gives you abilities to see the stories hiding in the graphs of the stock, forex, and crypto currency markets. It counts CC59 and creates respectable support and resistance levels as well as marks and reminds you about important parameters that are happening in the graph so that you will not forget to consider them before placing orders. These parameters include:
Automatic CC59 counting that compares the close of the right price bar to that of left price bar in a group of 5 consecutive bars (ignoring 3 bars in the middle). If the right bar closed higher, the count positive number would be printed above the bar. If the right bar closed lower, the count negative number would be printed below the bar. Nine consecutive series of up counts will define the lowest price as CC59 support line and nine consecutive series of down counts will define the highest price as CC59 resistance line. The counted numbers, support and resistance lines are automatically printed on the graph if enabled.
Draw the high and low levels of the previous day, if enabled. The Previous Day's High and Low are often used as reversal levels in the few future days.
Draw the price range of each day based on Average Daily Range (ADR) value.
Paint the background areas with active Forex trading of Asian, London, and New York sessions, if enabled.
Draw simple moving average lines such as SMA5, SMA50 with ability to change the line color based on increasing or decreasing prices. A set of other simple moving average lines such as SMA13, SMA200, SMA800 can be drawn if enabled.
Draw a ribbon of simple moving average lines consisting of SMA3, SMA4, SMA6 and SMA7, if enabled. Twisting of the SMA ribbon gives a visual signal for price reversal.
Locate the price gaps in the graphs of stocks and indexes. The opened gaps are often closed later on. Hence, they are milestones for the price to come back and close them up.
Locate the pin bars having the body portion less than a specific percent of the range. The pin bars show hestitation for the price to continue the current trend. When a pin bar is covered or engulfed by the next larger bar, a trend reversal offen follows.
Draw Bollinger bands (50,2), if enabled.
Automatic printing of the events happening in the graph to remind the readers of parameters under considerations (if enabled) including:
- Print "C>SMA5" and "C13" and "SMA5<13" for SMA(5) crossed above and below SMA(13).
- Print "Max" and "Min" for local maximum and local minimum bars.
- Print "RSI>70" and "RSI<70" for RSI(14) that crossed above 70 % and below 70 %.
- Print "RSI<30" and "RSI>30" for RSI(14) that crossed below 30 % and above 30 %.
- Print "MACD>0" and "MACD<0" for MACD(12,26,9) that crossed above and below zero.
- Print "MACD>Sig" and "MACD

ADR - Average Daily Range [@treypeng] [v2]
This is an intraday indicator.
Average Daily Range provides an upper and lower level around the daily open. It is calculated by taking an EMA/SMA average of a given number of previous days' True Range.
It can be useful for helping guide support and resistance, for taking profits and for placing stops.
It's a similar idea to the ATR indicator, but calculated on a daily timeframe only.
Settings:
Length: number of days to take an average from
Offset: Set this to 0 to include today's range. Set to 1 to exclude today. Set to 2 to exclude today and yesterday.....and so on.
The other settings should be self explanatory :)


5 Day ADR ICT Intraday TrackerPretty self explanatory, this indicator tracks todays current range as a % of the 5 Day ADR.
This is most useful for finding entries and looking for exits intraday, ie: how much hypothetical room is there for a trade to run? looking for entries in yellow and orange zones, exiting in blue once the ADR is reached etc.
Reset variable should be used for the end of day close. For forex on Oanda its 1700. Probably a way to do this programatically, if its obvious let me know and i can update it.
Can be set to clip output above 110% once the daily ADR has been fulfilled - this can be turned on or off.
Experimental mode for finding consolidations, based on the ADR for each day not been fulfilled and contracting. can be good for finding pending range expansion.
Code is pretty ugly, feel free to tweak.
current known issues: Indicator doesnt work for many non forex pairs, due to coding laziness. Indicator does not work on 1 minute timeframe.

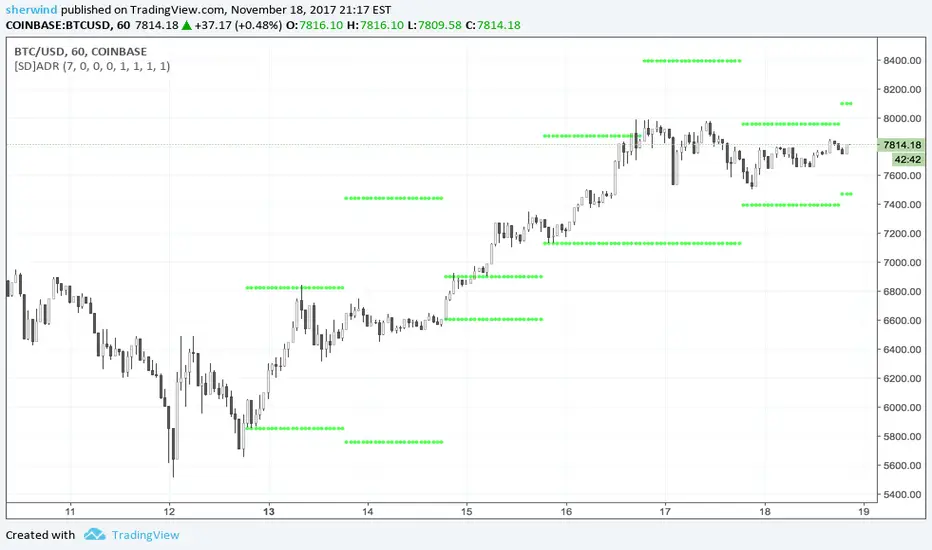
SD - Average Daily Range - Daily Weekly Monthly YearlyAverage Daily Range ('ADR') Indicator for TradingView
This script is based on the "Best 'ADR' Indicator for MT4" described at www.fxdayjob.com
Inputs:
Number of 'ADR' Back - Set the number of calendar days back to plot historical 'ADR'. The default value is 7.
Non-trading days are not taken into account.
A value of 7, for example, would display only 5 'ADR' for a 24x5 market.
Number of 'AWR' Back - Set the number of calendar weeks back to plot historical 'AWR'. The default value is 0.
Number of 'AMR' Back - Set the number of calendar months back to plot historical 'AMR'. The default value is 0.
Number of 'AYR' Back - Set the number of calendar years back to plot historical 'AYR'. The default value is 0.
'ADR' Length parameter - Set the length parameter of 'ADR'. The default value is 1.
'WDR' Length parameter - Set the length parameter of 'AWR'. The default value is 1.
'MDR' Length parameter - Set the length parameter of 'AMR'. The default value is 1.
'YDR' Length parameter - Set the length parameter of 'AYR'. The default value is 1.
See also:
- www.fxdayjob.com
- pivotboss.com
- www.jarrattdavis.com
Average Daily Range - without open barBasic ADR-indicator that is showing the daily range on lower timeframes as well, without using the current open daily bar for calculation.
Also plots as line in a separate indicator window. Updates displayed value when hovering over the candles on the chart to see historical Numbers.

