EMA 21 + MacD + RSI + Alma
Setting
EMA 21 = Green
EMA 9 = yellow
MacD = 5 35 5
RSI = 10
Alma 20 0.8 8
RULES
Long:
1. EMA 9 below 21
2. RSI above 50 from Oversold
3. Macd Solid green
4. SL @ ALMA
5. Conditional buy limit order @ top wick
6. 1:3 RR
Short:
1. EMA 9 above 21
2. RSI below 50 from Overbought
3. Macd Solid red
4. SL @ ALMA
5. Conditional sell limit order @ bottom wick
6. 1:3 RR
Alma
Gators Oscillator - Bitcoin Scalp Trader(T&M/e V3!!)Gator's Oscillator:
**For reference, all numbers, and settings displayed on the input screen are only what I HAVE FOUND to be profitable for my own strategy, Yours will differ. This is not financial advice and I am not a financial advisor. Please do your due diligence and own research before considering taking entries based on this strategy and indicator. I am not advertising investing, trading, or skills untaught, this is simply to help incorporate into your own strategy and improve your trading journey!**
INPUTS:
EV: This is an integer value set to default at 55. This value is equated to the lead value, volatility measurement, and standard deviation between averages
EV 2: This integer is used as the base value and is meant to always be GREATER THEN EV, the default is set at 163. There should be at least a 90+ integer difference between EVs for data accuracy.
EV TYPE & EV TYPE 2: This option only affects the output for the moving average histograms. (and data inserted for strategy)
Volatility Smoothing: This is the smoothness of the custom-made volatility oscillator. I have this default at 1 to show time-worthy-term (3.9%+) moves or significant trends to correspond with the standard deviation declination between EVMA and EVMA2.
Directional Length: This is the amount of data observed per candle in the bull versus bear indicator.
Take Profit: Pre-set takes profit level that is set to 4 but can be adjusted for user experience.
Style:
Base Length: Columns equated using a custom-made statistical equation derived from EV TYPE 2+EV2 to determine a range of differential in historic averages to a micro-scale.
Lead Length: Columns equated using a custom-made statistical equation derived from EV TYPE+EV to determine a range of differential in historic averages to a micro-scale.
Weighted EMA Differential: Equation expressing the differences between exponential and simple averages derived from EV+EV Type 2. Default is displaying none, but optional for use if found helpful.
Volatility: Represents volatility from multiple data sets spanning from Bollinger bands to HPV and translated through smoothing.
Bull Strength: The strength of Bulls in the current trend is derived from a DMI+RSI+MACD equation to represent where the trend lies.
Bear Strength: The strength of Bears in the current trend is derived from a DMI+RSI+MACD equation to represent where the trend lies.
(NEW) Standard Deviation between Moving Averages: Use this logarithmic indicator depicted as circles to help determine whether a move is a fake out or not. Compare the circles with the volatility line, if you see them deviating away, it is either a bull/bear trap or trend continuation is imminent until they correlate back together.
CHEAT CODE'S NOTES:
Do not use this indicator on high leverage. I have personally used this indicator for a week and faced a max of 8% drawdown, albeit painful I was on low leverage and still closed on my take profit level.
85% is not 100% do not overtrade using this indicator's entry conditions if you have made 4 consecutive profitable trades.
Mess around with the input values and let me know if you find an even BETTER hit rate, 30+ entries, and a good drawdown!!
V2 UPGRADES:
*Increased Opacity on Bull Bear Columns
*Removed the Stop Loss Input option
*Decreased EV2 to a default of 143 for accuracy
*Added additional disclaimers in the description
* Removed Bull/Bear offset values for accuracy
V3 UPGRADES:
*ADDED THE EMA DIFFERENTIAL FROM SMA STANDARD DEVIATION INDICATOR. REPRESENTED BY PURPLE BARS THAT PLOT BRIGHT AT EXTREME LEVELS (Translate this to the EMA's and SMA's are very far apart) This is a fantastic way to resolve volatility and momentum in one indicator!!
*Line Width increased for volatility
*plot's for Oversold Alma reduced to 3, also adjusted the plot shape to arrows corresponding to 'overbought/oversold values. Look for a cross-over from green/red plot to transparent for best signals.
*Histograms for bull/bear strength correspond to an increase or decrease in value
*Input screen converted into groups, with bull/bear color inline
*Converted base/lead length value's into areas with breaks. IF YOU SEE WHITE (Short/Lead Length), IT IS A SHORT TERM MOVE AND SCALPING OPPORTUNITY. IF YOU SEE BLUE(Long/Base Length) IT MEANS IT IS A MACRO MOVE, WHICH MAY LAST LONGER
-Cheat Code
BINANCE:BTCUSDT BYBIT:BTCUSDT COINBASE:BTCUSD

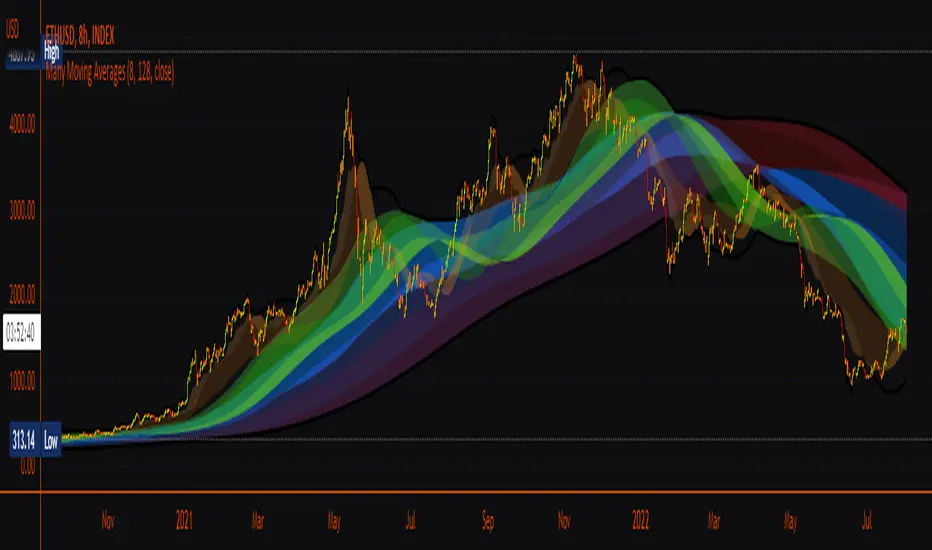
Many Moving AveragesA smooth looking indicator created from a mix of ALMA and LRC curves. Includes alternative calculation for both which I came up with through trial and error so a variety of combinations work to varying degrees. Just something I was playing around with that looked pretty nice in the end.
ALMA stdev band with fibsArnaud Legoux Moving Average with standard deviation band and standard deviation Fibonacci levels.
Standard deviation band is alma + stdev and alma - stdev.
Fibonacci levels are alma + stdev * fib ratio and alma - stdev * fib ratio (0.382 / 0.5 / 0.618 / 1.618 / 2.618).
Used like a moving average, but also shows probable price range based on past volatility, and helps to recognize support/resistance levels, trends and trend momentum based on the Fibonacci levels.

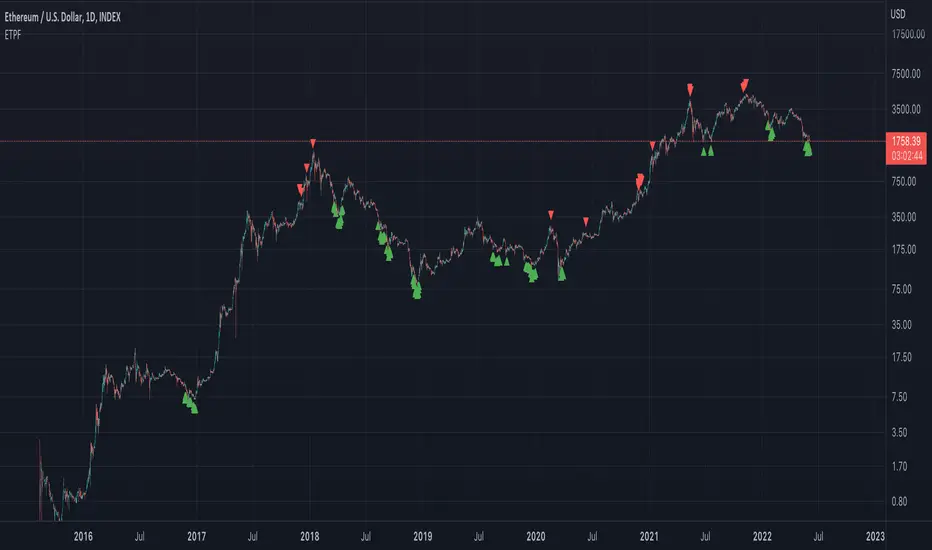
Exponential Top and Bottom FinderThis is an indicator to identify possible tops and bottoms after exponential price surges and drops, it works best on ETH 1D, but you can also use it for bitcoin and altcoins.
It's based on stochastic first and second derivatives of a close moving average
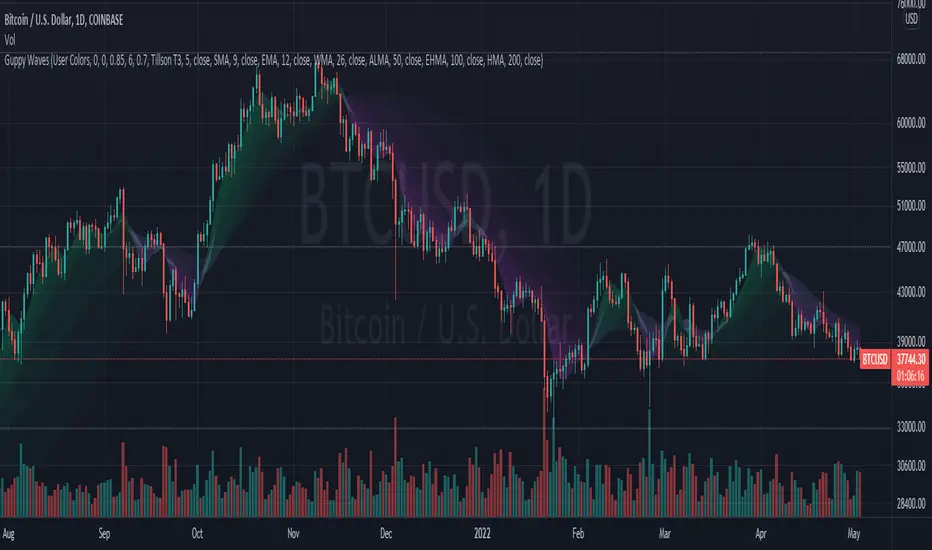
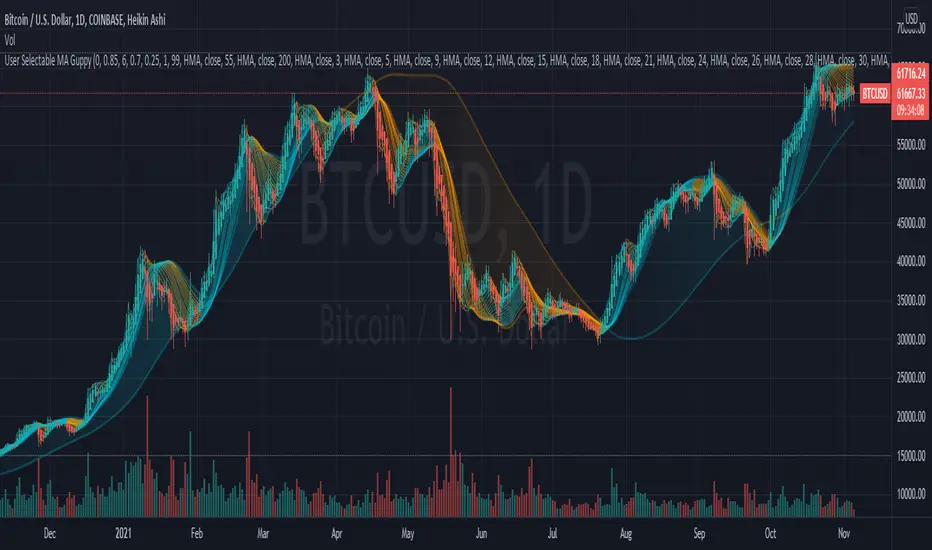
Guppy WavesA lightweight version of the popular "Moving Average Ribbon" or "Guppy" indicators where the visuals are plotted as "waves" rather than moving average lines. As is customary for my indicators, nearly everything about it is user selectable.
Visual Features:
User Customizable Colors
RSI-Based Rainbow Color Scheme
Simple Offset for adjusting transparency
Create great-looking charts very easily
Moving Average Options:
Running (SMoothed) Moving Average (RMA or SMMA ) - very slow/smooth
Simple Moving Average ( SMA )
Exponential Moving Average ( EMA )
Weighted Moving Average ( WMA )
Volume-Weighted Moving Average ( VWMA )
Triple EMA ( TEMA ) - very fast
Exponential Hull Moving Average (EHMA) - Hull with Smoothing (Slower than Hull)
Least Squares Moving Average ( LSMA ) - Simple Linear Regression
Arnaud Legoux Moving Average ( ALMA ) - Adjustable, set offset=1 to be current, offset=0.85 for good smoothing
Hull Moving Average ( HMA ) - very fast
Tillson T3 - very smooth
Donchian Moving Average - plots the average of (lowest, highest) for a given period length
The user can change the source, period, and type of moving average used for every single line on the chart.
ALMA cross signal by hk4jerry<< ALMA CROSS signal >>
*NONE REPAINT STRATEGY*
--As a result of testing for a month, using alma does not result in repainting--
--ALMA 크로스 결과는 한달간의 테스트 결과, 리페인팅되지 않습니다--
(ENGLISH description O)
==NOTE==
1. MA 크로스 지표는 잘못된 신호들이 자주 등장합니다. 정확성을 더 높일수 있는 방법은 없을까 고민을 해봤습니다. 더 낮은 가격에 매수하고, 더 높은 가격에서 매도하는 것이 중요했습니다. 우리가 흔히 저점, 고점을 알아내기 위한 지표이자, 선행지표인 RSI를 추가하는 방법을 연구했습니다.
2. 예를 들어, MA 크로스 매수 신호가 발생했을때, rsi값이 50이면 가격이 더 떨어질 가능성이 큽니다. 하지만, rsi값이 30이하인 경우에만 매수 신호가 발생한다면, 그 가격이 저점일 확률이 매우 높아지는 원리 입니다.
3. 신호는 확률입니다. 트레이딩에 100%는 없습니다. 그 확률을 높이는 것은 리스크 관리 입니다. 분할 매수 관점으로 포지션을 잡으시거나, 단기 매매로 가져가시는걸 추천드립니다.
==rsi ma source 설정==
1. 'rsi ma' 값의 소스입니다.
2. 'rsi 길이' 는 값이 클수록 더욱 정확한 시그널이 발생합니다.
3. EMA 길이가 짧을수록 더 많은 시그널이 발생합니다. 그러나, 정확도는 떨어집니다.
==rsi ma 설정==
1. rsi를 source로한 EMA입니다.
2. rsi와 유사한 성격을 가집니다.
3. 'rsi ma' 값이 30이하이면 과매도, 70이상이면 과매수 입니다.
4. ' rsi ma long value' 이 30이면 매수 신호가 rsi ma 값이 30 이하인 경우에만 발생함을 의미 합니다.
5. "rsi ma short value' 가 70이면 매도 신호가 rsi ma 값이 70 이상인 경우에만 발생함을 의미 합니다.
==rsi 설정==
1. 실제 rsi(14,close) 값을 의미합니다.
2. rsi ma value와 비슷한 기능입니다.
3. rsi 길이가 14이므로, 값은 40~50 사이가 적당합니다.
4. 30 또는 70으로 설정할 시, 신호가 거의 발생하지 않습니다.
(ENG)
==NOTE==
1. MA cross indicator often shows false signals. I was wondering if there is a way to increase the accuracy further. It was important to buy at a lower price and sell at a higher price. We studied how to add RSI, which is a leading indicator and an indicator to find lows and highs, often.
2. For example, when a buy MA cross signal occurs, if the rsi value is 50, the price is more likely to fall. However, if a buy signal occurs only when the rsi value is below 30, the probability that the price is at the bottom is very high.
3. A signal is a probability. There is no 100% in trading. Increasing that probability is risk management. It is recommended to hold a position from the perspective of a split buy or take it as a short-term trade.
==rsi ma source option==
1. The source of the 'rsi ma' value.
2. The larger the 'rsi length' value, the more accurate the signal is generated.
3. Shorter EMA lengths produce more signals. However, the accuracy is reduced.
==rsi ma options==
1. EMA with rsi as the source.
2. It has similar characteristics to rsi.
3. If the 'rsi ma' value is below 30, it is oversold, and if it is above 70, it is overbought.
4. If 'rsi ma long value' is 30, it means that a buy signal will only occur when the rsi ma value is less than or equal to 30.
5. If "rsi ma short value' is 70, it means that a sell signal will only occur when the rsi ma value is above 70.
==rsi option==
1. It means the actual rsi(14,close) value.
2. This function is similar to rsi ma value.
3. Since the rsi length is 14, a value between 40 and 50 is appropriate.
4. When set to 30 or 70, almost no signal is generated.

EMA 9 + ALMA 20 + BB 50 .2COMBINATION OF EMA, ALMA,BB50 .2
Protected script
This script is published closed-source and you may use it freely. You can favorite it to use it on a chart. You cannot view or modify its source code.
Disclaimer
The information and publications are not meant to be, and do not constitute, financial, investment, trading, or other types of advice or recommendations supplied or endorsed by TradingView. Read more in the Terms of Use.

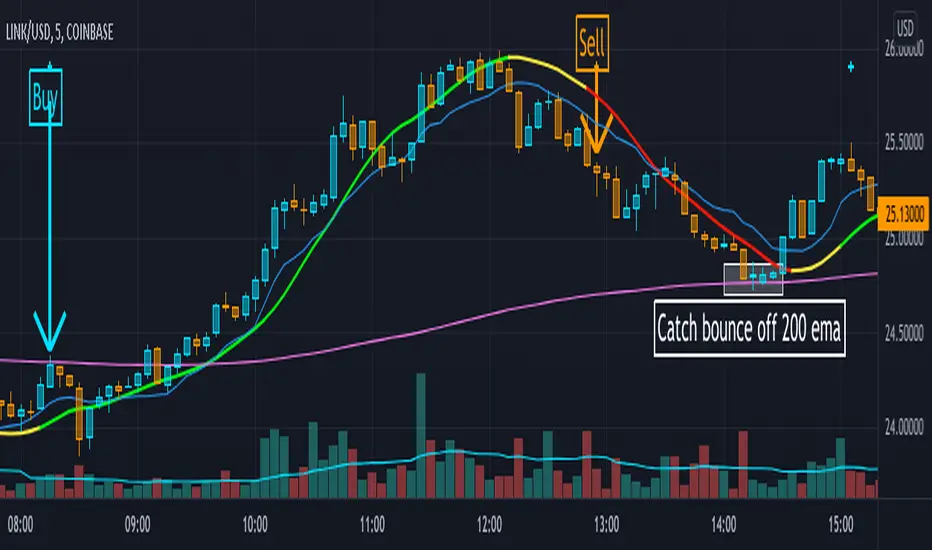
BUY/SELL SIGNALS from LSMA/ALMA/HMAThis indicator uses the Least Squares Moving Average (LSMA) in tandem with the Arnaud Legoux Moving Average (ALMA) and Hull Moving Average (HMA) to generate buy-sell signals, represented by the light blue and orange crosses respectively.
The yellow lines produced by the indicator show periods of market uncertainty and possible reversal, and a modified, user-defined VWAP is given along with a 200 EMA. The point of this indicator was to create a smoother, more visually appealing moving-average, price action-based indicator when compared to the trend-step and simple moving average indicators available. This indicator uses a fast (25 period) LSMA coupled with a slower (50 period) HMA and ALMA in order to make signals both smooth and fast.
This indicator will work on all markets, except the modified VWAP will naturally not function if the volume is unpublished for that market. Use of this indicator will be very strong in trending markets, as the yellow line will spot possible reversals quite early, meaning the trader can be ready early for the buy/sell signal to appear. Use of this indicator in sideways market conditions will be limited, as it is for all moving average-based indicators, but the damage will be minimal as bad trades will be quickly realized by the indicator and the color will switch to yellow, this is possible because of the settings differences between the period lengths of the LSMA vs the ALMA + HMA.
Moving Average MultitoolI made this script as a personal tool while backtesting multiple moving averages. It allows you to easily access and switch between different types of moving averages, without having to continuously add and remove different moving averages from your chart.
It also has the option to show the a 14 period average distance between the closing price of an asset and the selected moving average, as a multiple of ATR. This number can be shown by enabling the "Show ATR Between MA and Close" setting. The intention of this value is to quantify and compare the speed of different moving averages across any instrument and any timeframe. The higher the value, the slower the moving average. The lower the value, the faster the moving average.

Keltner Channel With User Selectable Moving AvgKeltner Channel with user options to calculate the moving average basis and envelopes from a variety of different moving averages.
The user selects their choice of moving average, and the envelopes automatically adjust. The user may select a MA that reacts faster to volatility or slower/smoother.
Added additional options to color the envelopes or basis based on the current trend and alternate candle colors for envelope touches. The script has a rainbow gradient by default based on RSI.
Options (generally from slower/smoother to faster/more responsive to volatility):
SMMA,
SMA,
Donchian, (Note: Selecting Donchian will just convert this indicator to a regular Donchian Channel)
Tillson T3,
EMA,
VWMA,
WMA,
EHMA,
ALMA,
LSMA,
HMA,
TEMA
Value Added:
Allows Keltner Channel to be calculated from a variety of moving averages other than EMA/SMA, including ones that are well liked by traders such as Tillson T3, ALMA, Hull MA, and TEMA.
Glossary:
The Hull Moving Average ( HMA ), developed by Alan Hull, is an extremely fast and smooth moving average . In fact, the HMA almost eliminates lag altogether and manages to improve smoothing at the same time.
The Exponential Hull Moving Average is similar to the standard Hull MA, but with superior smoothing. The standard Hull Moving Average is derived from the weighted moving average ( WMA ). As other moving average built from weighted moving averages it has a tendency to exaggerate price movement.
Weighted Moving Average: A Weighted Moving Average ( WMA ) is similar to the simple moving average ( SMA ), except the WMA adds significance to more recent data points.
Arnaud Legoux Moving Average: ALMA removes small price fluctuations and enhances the trend by applying a moving average twice, once from left to right, and once from right to left. At the end of this process the phase shift (price lag) commonly associated with moving averages is significantly reduced. Zero-phase digital filtering reduces noise in the signal. Conventional filtering reduces noise in the signal, but adds a delay.
Least Squares: Based on sum of least squares method to find a straight line that best fits data for the selected period. The end point of the line is plotted and the process is repeated on each succeeding period.
Triple EMA (TEMA) : The triple exponential moving average (TEMA) was designed to smooth price fluctuations, thereby making it easier to identify trends without the lag associated with traditional moving averages (MA). It does this by taking multiple exponential moving averages (EMA) of the original EMA and subtracting out some of the lag.
Running (SMoothed) Moving Average: A Modified Moving Average (MMA) (otherwise known as the Running Moving Average (RMA), or SMoothed Moving Average (SMMA)) is an indicator that shows the average value of a security's price over a period of time. It works very similar to the Exponential Moving Average, they are equivalent but for different periods (e.g., the MMA value for a 14-day period will be the same as EMA-value for a 27-days period).
Volume-Weighted Moving Average: The Volume-weighted Moving Average (VWMA) emphasizes volume by weighing prices based on the amount of trading activity in a given period of time. Users can set the length, the source and an offset. Prices with heavy trading activity get more weight than prices with light trading activity.
Tillson T3: The Tillson moving average a.k.a. the Tillson T3 indicator is one of the smoothest moving averages and is both composite and adaptive.

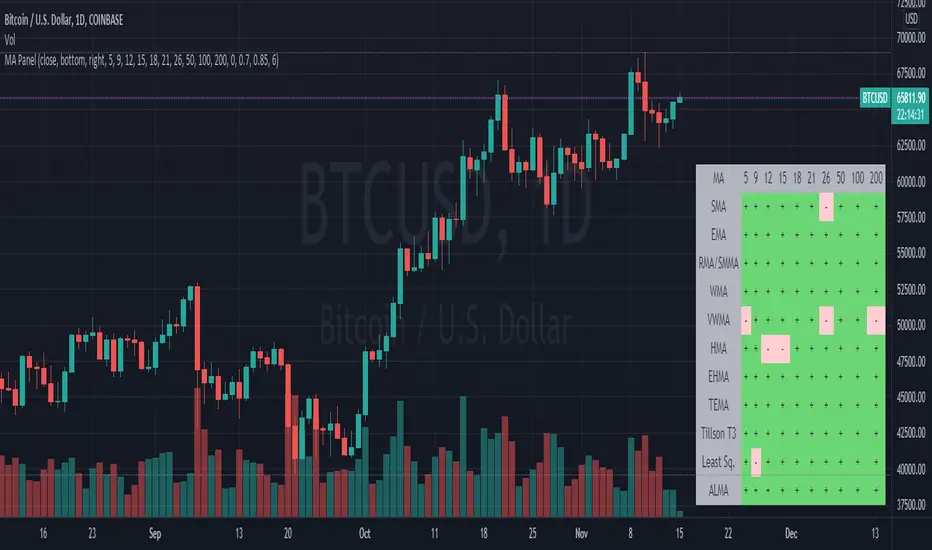
Moving Average PanelThis indicator calculates many different moving averages and displays whether they are increasing or decreasing as a panel/table instead of a plot. Rows/columns can be removed from the table as needed in the options menu, there is also a mobile friendly/compact option as well as a location option.
Note: This script is large and may take a few moments to load.
Note: If there is not enough data, will default to bearish/decreasing.
Value Added
This is the most complete and transparent moving average panel/table indicator. Unlike things such as the Technical Ratings, you can see what components are increasing or decreasing.
There may be some advantage in judging if a trend is likely to reverse or not based on the MA's with less lag.
Good for quick screening of charts.
User Selectable Moving Average GuppyA version of the popular "Moving Average Ribbon" or "Guppy" indicators, except nearly everything about it is user selectable. The user can change the source, period, and type of moving average used for every single line on the chart. Note: The visuals are fairly intensive and may take a moment to catch up after adjusting settings.
Credit: This script utilizes the "Color Gradient Framework" tutorial by LucF (PineCoders) to create gradient visuals, which are also customizable for the user.
Moving Average Options:
Running (SMoothed) Moving Average (RMA or SMMA) - Slowest
Simple Moving Average (SMA) - Slow
Exponential Moving Average (EMA) - Responds faster to price than SMA
Weighted Moving Average (WMA)
Volume-Weighted Moving Average (VWMA)
Triple EMA (TEMA)
Exponential Hull Moving Average (EHMA) - Hull with Smoothing (Slower than Hull)
Least Squares Moving Average (LSMA) - Simple Linear Regression
Arnaud Legoux Moving Average (ALMA) - Adjustable, set offset=1 to be current, offset=0.85 for good smoothing (Slower)
Hull Moving Average (HMA) - Normally responds fastest to price of all options
Value Added :
This script is unique in that it allows the user to chart the "Guppy", except nearly everything about it is customizable. The user can change the source, period, and type of moving average used for every single line.
Typically, the Guppy is plotted with simple moving average or exponential moving average, which respond much slower to price than the Hull Moving Average, which this indicator uses as default. (Elimination of lag)
The Hull MA settings for the highest time frame moving averages should work well for assessing the overall macro trend, with a nice visual presentation. Additional labels and alerts for the macro trend are available.
Furthermore, this script provides many more options for type of moving average than is typical for a moving average indicator that provides the user with options, including advanced options such as Hull, TEMA, and ALMA.
The visual presentation is customizable and should provide some entertainment for users who want to create pretty charts.
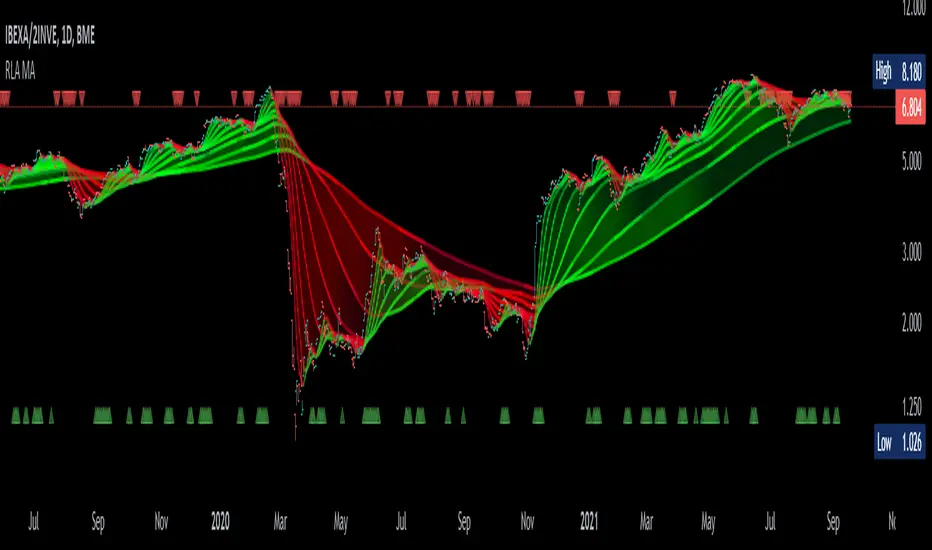
Alma Moving Average Ribbon Reverse Length [DM]Greetings Colleagues
Following some recommendations and ideas I share this moving average, put all of them together
The length calculation is automatic there is only one input.
The length is inverse so it will wrap from the longest reference point, hence using phi
Moving averages will wrap around the price.
I've also added gradient color to plots and fill plots
There is an alert selector in case you are interested in a particular crossing, "remember that the order is reversed".
There is an alert visual plotshapes with offset signal.
Finally, after spending a few hours with the Williams alligator moving averages I found nothing special, but I added the individual offset adjustment for each moving average in case someone comes up with something.
Enjoy”
Some references about alma by "tradingview pinecoders"
What to look for
The Arnaud Legoux Moving Average has three elements to it:
Window: This element is the period. By default, the window is set to 9 periods, but it can be customized to fit any trading style.
Offset: This element is the Gaussian that is applied to the combo line and can be aligned to the current price. It’s default is set to 0.85, but by setting it to 1, you can make it align fully to the current price (similar to how an Exponential Moving Average (EMA) with a setting of 0 is like a Simple Moving Average (SMA)). 0.85 is what is recommended, however, you can customize it like with the window element.
Sigma: This element is a standard deviation that is applied to the combo line in order for it to appear more sharp. The default is set to 6 and it is not recommended to change the setting. The value of 6 is inspired by the Six Sigma process.
www.tradingview.com
Bollinger Bands With User Selectable MABollinger Bands with user selection options to calculate the moving average basis and bands from a variety of different moving averages.
The user selects their choice of moving average, and the bands automatically adjust. The user may select a MA that reacts faster to volatility or slower/smoother.
Added additional options to color the bands or basis based on the current trend and alternate candle colors for band touches. Options:
REACT SLOW/SMOOTH TO VOLATILITY
simple moving average (Regular Bollinger Bands)
REACT SMOOTH TO VOLATILITY
exponential moving average (EMA Bollinger Bands)
weighted moving average (Weighted MA Bollinger Bands)
exponential hull moving average (Hull Bollinger Bands with better smoothing)
HIGHLY ADJUSTABLE TO VOLATILITY
Arnaud Legoux Moving average (ALMA Bollinger Bands)
Note: 0.85 ALMA default for more smoothing, set offset=1 to turn off smoothing
REACT HARSH TO VOLATILITY
least squares moving average (Least Squares Bollinger Bands)
REACT VERY FAST TO VOLATILITY
hull moving average (Hull Bollinger Bands or Hullinger Bands)
VALUE ADDED: This script is unique in that no other Bollinger Bands indicator offers a user selection for moving average, and some of the options do not exist yet as Bollinger Bands indicators.
Definitions:
Bollinger Bands: A Bollinger Band® is a technical analysis tool defined by a set of trendlines plotted two standard deviations (positively and negatively) away from a simple moving average (SMA) of a security's price, but which can be adjusted to user preferences.
Exponential Bollinger Bands: The most important characteristics of the Exponential Bollinger Bands indicator are: When the market is flat, the bands will stay much closer to prices. When the volatility is high, the bands move away from prices faster.
Hull Bollinger Bands: Bollinger Bands calculated by Hull moving average, rather than simple moving average or ema. The Hull Moving Average (HMA), developed by Alan Hull, is an extremely fast and smooth moving average. In fact, the HMA almost eliminates lag altogether and manages to improve smoothing at the same time.
Exponential Hull Bollinger Bands: Bollinger Bands calculated by Exponential Hull moving average, rather than simple moving average or ema. The Exponential Hull Moving Average is similar to the standard Hull MA, but with superior smoothing. The standard Hull Moving Average is derived from the weighted moving average (WMA). As other moving average built from weighted moving averages it has a tendency to exaggerate price movement.
Weighted Moving Average Bollinger Bands: A Weighted Moving Average (WMA) is similar to the simple moving average (SMA), except the WMA adds significance to more recent data points.
Arnaud Legoux Moving Average Bollinger Bands: ALMA removes small price fluctuations and enhances the trend by applying a moving average twice, once from left to right, and once from right to left. At the end of this process the phase shift (price lag) commonly associated with moving averages is significantly reduced. Zero-phase digital filtering reduces noise in the signal. Conventional filtering reduces noise in the signal, but adds a delay.
Least Squares Bollinger Bands: The indicator is based on sum of least squares method to find a straight line that best fits data for the selected period. The end point of the line is plotted and the process is repeated on each succeeding period.

Arnaud Legoux Moving Average Set [DM]Greetings Colleagues
As it could not be otherwise in the soul series could not miss its own moving average.
Here you can enjoy 3 soul moving averages with color variables and alerts on all crosses of the three moving averages
/// Quick Explained ALMA ///
//Window size: The window size is the look-back period and it is a basic setting of ALMA.
//Experienced traders can change this setting according to their preference.
//But if you are using this indicator for the first time, it is recommended to go with the default setting.
//Offset: The offset value is used to tweak the ALMA so that it will be more inclined
//towards responsiveness or smoothness. You can set the offset in decimals between the 0 to1.
//The value of 0.01 makes it smoother, while a setting of 0.99 makes the indicator more responsive.
//Sigma: The sigma is used for the filter. Any value less than 6 makes the indicator
//more focused, whereas the setting of 6 makes the filter large. According to Mr Arnaud,
//a sigma value of 6 is offer good performance.

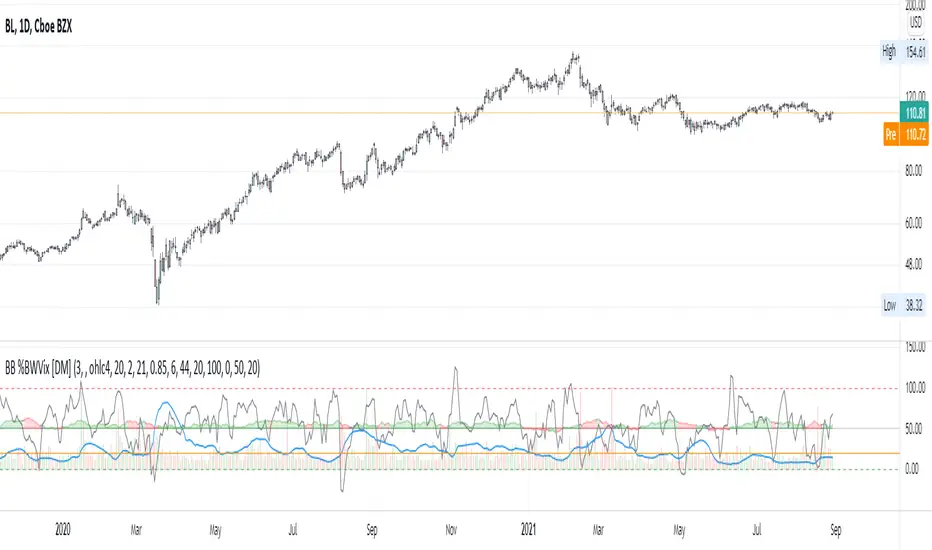
Bollinger Bands Width + %B + Vol. + Intraday Idx Alma var [DM]Greetings Colleagues here I published another script of the series "Alma Variant"
This script incorporates four different standard signals from Bollinger Band Book.
Signals:
Bollinger Band Width. Line blue
Bollinger Band %B. Line gray
Intraday intensity Index “normalized using log(volume)”. Oscillator line in the middle of the indicator with decision color green = buy, red=sell, purple=na
Bollinger Band Volume “normalized, decreased to 20% and limited to 100”
Alerts:
Bollinger Band (%B) Alert Level with your switch
Bollinger Band (Width) Alert Level with your switch
BB (Volume) Alert with your switch
Setting.
Individual ma settings
All alerts can be adjusted
The color of the Intraday intensity index background and lines help you decide on your volatility breakout direction
The background color has been conditioned to smoothed X periods for the accumulated volume above the alert level, Intraday Intensity Index direction and %B direction.
I recommend for the use of this indicator to first read John Bollinger's book to understand the usefulness of each of the signals and their configuration to execute the orders.
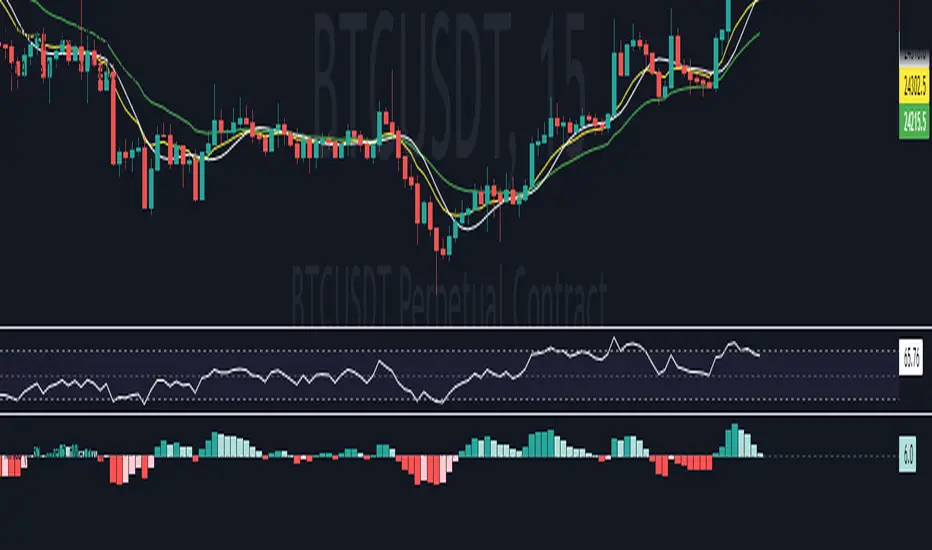
Full Crypto Swing Strategy ALMA Cross with MACDThis is a full crypto swing strategy designed.
From my testing it looks like it perform the best on timeframes 4h +.
The below example has been adapted to BNB/USDT, using the entire period since 2017 until present day, with a comission of 0.03% ( which is the comission for the futures on binance).
Its components are :
ALMA Fast
ALMA Slow
MACD Histogram
Rules for entry
For long, we have a crossover of the fast alma with the slow one and the histogram is ascending.
For short, we have a crossunder of the fast alma with the slow one and the histogram is descending.
Rules for exit
We exit based on a risk management system for TP and SL, or when we receive an opposite condition than the initial one.
Regarding risk management
0.05 = 5% movement
2 = 200% movement
0.001 = 0.1% movement
If you have any questions, let me know !

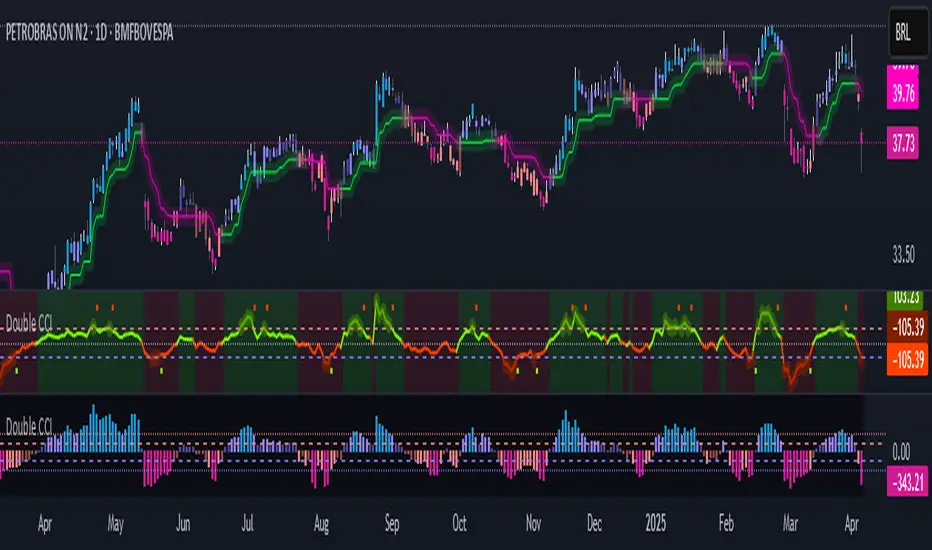
Double CCIThe Commodity Channel Index (CCI) is a momentum oscillator used in technical analysis primarily to identify overbought and oversold levels by measuring an instrument's variations away from its statistical mean. Besides overbought/oversold levels, CCI is often used to find reversals as well as divergences. Originally, the indicator was designed to be used for identifying trends in commodities, however it is now used in a wide range of financial instruments.
There are several steps involved in calculating the CCI. The following example is for a typical 14 Period CCI:
CCI = (Typical Price - 14 Period SMA of TP) / (.015 x Mean Deviation)
Typical Price (TP) = (High + Low + Close)/3
Constant = .015
The Constant is set at .015 for scaling purposes. By including the constant, the majority of CCI values will fall within the 100 to -100 range.
Mean Deviation:
1) Subtract the most recent 14 Period Simple Moving from each typical price (TP) for the Period.
2) Sum these numbers strictly using absolute values.
3) Divide the value generated in step 2 by the total number of Periods (14 in this case).
Overbought and Oversold conditions can be used in their more traditional sense to identify future reversals . Remember true overbought/oversold thresholds values can and often do vary between instruments.
During a Bullish Trend , price crossing above the overbought threshold may indicate strong confidence in the move and price will continue to rise.
During a Bearish Trend , price crossing below the oversold threshold may indicate strong confidence in the move and price will continue to fall.
The first option is a modified CCI indicator that uses the "Arnaud Legoux Moving Average" instead of the SMA, and the source uses the VWAP instead of the HLC3. Added to this version an option to calculate CCI with different types of moving averages:
Green dots mean they are overbought
Orange dots mean they are oversold
Added a "SuperTrend Background" based on the modified CCI indicator:
Bull event = CCI crossing over the 0 line
Bear event = CCI crossing below the 0 line
Added a signal as EMA (modified CCI, signal length)
The second option is a standard CCI indicator that shows a coloured histogram of important levels, giving a good visual of the CCI levels. Added to this version is an extra coloured level +/-200 and an option to use Traditional CCI calculations according to user @JustUncleL
LEVELS:
Aqua: Greater than 200.
Lavender: Greater than 100 and less than 200.
Dark Lavender: Greater than 0 and less than 100.
Dark Coral: Less than 0 and greater than -100.
Coral: Less than -100 and greater than -200.
Light Red: Less than -200.
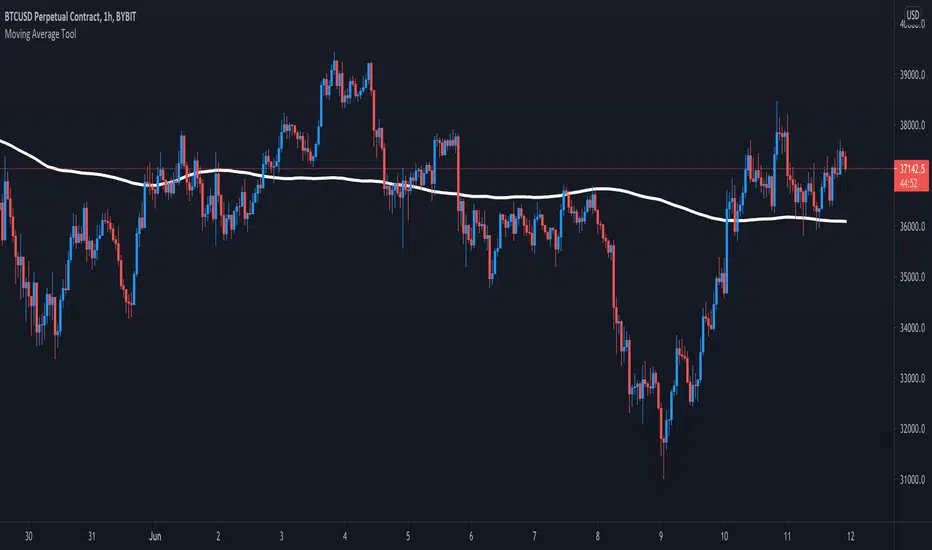
Moving Average ToolThe Moving Average Tool is the only indicator you will ever need to plot MA lines. It comes loaded with 9 different types of moving averages so traders can lay down any line at any length. There is also an option to plot a trigger line. Features: SMA , SMMA, EMA, LSMA, ZLSMA, HULL, LWMA, VWMA and ALMA. Simply pick an average type and enter the desired length.
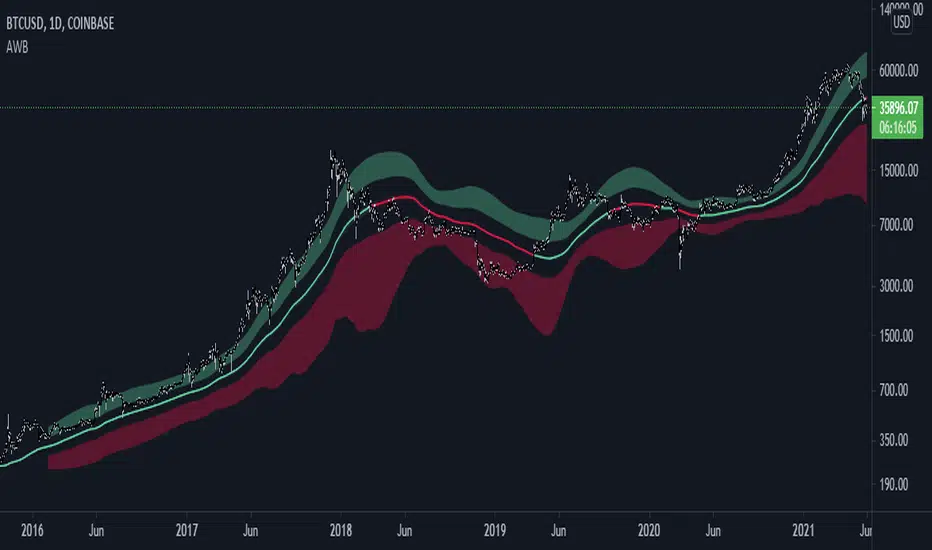
AWB - Alma Weird Bands [SilentShiller]A simple experiment that using Arnaud Legoux Moving Average tries to help visualize an extended trend and its reversal . You can play with:
Alma length
Alma offset ( needs sigma not to be 0 )
Alma sigma
I hope you find it useful. Feel free to modify it and let me know to test your scripts!
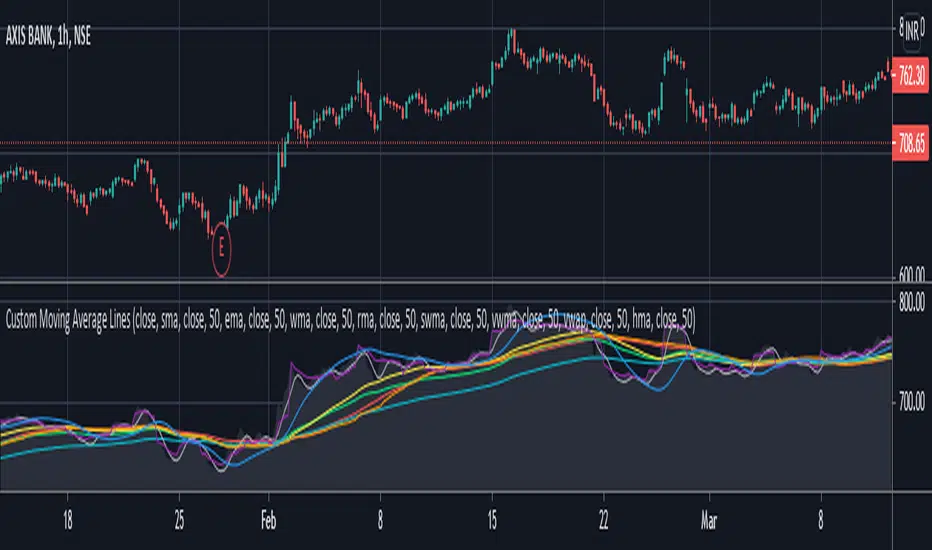
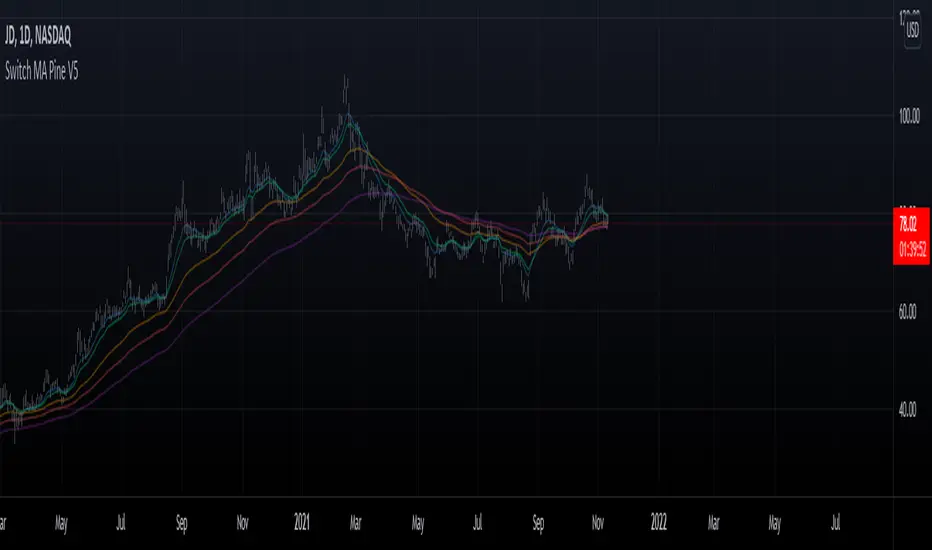
Custom Moving Average LinesHeylo!
This is a script for basic market trend analysis using moving average lines. It features eight lines with eight choices of moving averages and adjustable sources & time periods . The choice of moving averages are stated below:
1. Simple Moving Average (sma)
2. Exponential Moving Average (ema)
3. Weighted Moving Average (wma)
4. Relative Moving Average (rma)
5. Hull Moving Average (hma)
6. Sine-Weighted Moving Average (swma)
7. Volume Weighted Moving Average (vwma)
8. Volume Weighted Average Price (vwap)
Planning on including other formula based indicators soon. Let me know if there can be some improvements made / errors so I can fix it.
Cheers!