Portfolio: alpha, beta, stdev, variance, mean, max drawdown...Portfolio Metrics **New**
'returns'
'log returns'
'geometric returns'
portfolio alpha
portfolio beta
portfolio,market correlation
portfolio standard deviation
portfolio variance
mean portfolio returns
maximum drawdown
maximum gain
Alpha

Portfolio Metrics = α(Jensen's), β, CAPM(Ra), Sharpe, TreynorPortfolio Metrics...
Standard Deviation
Jensen's Alpha
Beta
Expected Return (CAPM, Ra)
Sharpe Ratio
Treynor Ratio
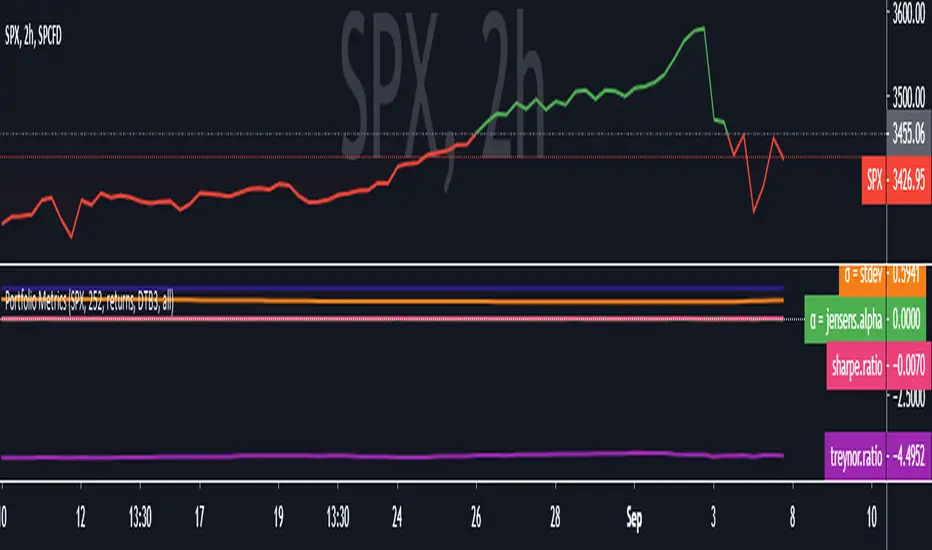
Alpha & BetaAlpha & Beta Indicators for Portfolio Performance
β = Σ Correlation (RP, RM) * (σP/σM)
α P = E(RP) –
Where,
RP = Portfolio Return (or Investment Return)
RM = Market Return (or Benchmark Index)
RF = Risk-Free Rate
How to use the Indicator
RM = SPX (Default)
The Market Return for the indicator has the options of $SPX, $NDX, or $DJI (S&P 500, Nasdaq 100, Dow 30)
RF = FRED: DTB3
The Risk-Free Rate in the Indicator is set to the 3-Month Treasury Bill: Secondary Market Rate
The Default Timeframe is 1260 or 5-Years (252 Trading Days in One Year)
RP = The symbol you enter
HOWEVER , you can determine your portfolio value by following the following directions below.
Note: I am currently working on an indicator that will allow you to insert the weights of your positions.
Complete Portfolio Analysis Directions
You will first need...
a) spreadsheet application - Google Sheets is Free, but Microsoft Excel will convert ticker symbols to Stocks and Retrieve Data.
b) your current stock tickers, quantity of shares, and last price information
In the spreadsheet,
In the first column list the stock tickers...
AMZN
AAPL
TSLA
In the second column list the quantity of shares you own...
5
10
0.20
In the third column insert the last price
Excel: Three tickers will automatically give you the option to "Convert to Stocks",
after conversion, click once on cell and click the small tab in the upper right-hand of the highlighted cell.
Click the tab and a menu pops up
Find "Price", "Price Extended-Hours", or "Previous Close"...
$3,284.72
$497.48
$2,049.98
Next, multiply the number of shares by the price (Stock Market Value)
Excel: in fourth column type "=(B1*C1)", "=(B2*C2)", "=(B3*C3)"...
= $16,423.60
= $4,974.80
= $410.00
add the three calculated numbers together or click "ΣAutoSum" (Portfolio Market Value)
= $21,808.40
Last, divide the market value of AMZN ($16,423.60) by the Portfolio Market Value ($21,808.40) for each of the stocks.
= 0.7531
= 0.2281
= 0.0188
These values are the weight of the stock in your portfolio.
Go back to TradingView
Enter into the "search box" the following...
AMZN*0.7531 + AAPL*0.2281 + TSLA*0.0188
and click Enter
Now you can use the "Alpha & Beta" Indicator to analyze your entire portfolio!

Alpha BandsAlpha Bands, this is a new idea I've been playing with recently in all my indicators.
In layman terms we are here using mult to multiply length of the plot to replicate effect of multi time frame plot. Under the hood it is basically fast ma crossing over slow one but with this simple multiplier introduction is able to give it properties of higher TF ma's but without the usual problem of the TV where multitimeframe MA plots rather crudely if you use security function.
Introducing it as core trend indicator, and around it I've utilized ATR to create simple but complete indicator to give good view of the market state and trend. Due to this setup it can be used for both trending and mean reversion trades, you can also utilize existing ranges for entry, exit and SL.
This indicator is example of how simple little tweaks can turn a age old tools into more advanced solutions.
This is purely for educational purposes, any past or claimed results may not replicate themselves while you trade them so use your own discretion. Author takes no responsibility of individual traders success or loss on this.
Source code will be protected since there is trend on TV where ideas are stolen and sold to unsuspecting retailers.

Fill Strength Gradient [BigBitsIO]This script plots two moving averages but is mostly designed to highlight a fill strength gradient. The fill strength gradient shows a more opaque fill based on the current percentage difference of the current difference to the maximum difference in two MAs in a trend.
Citation: PinceCoders - Slight modification on color functions

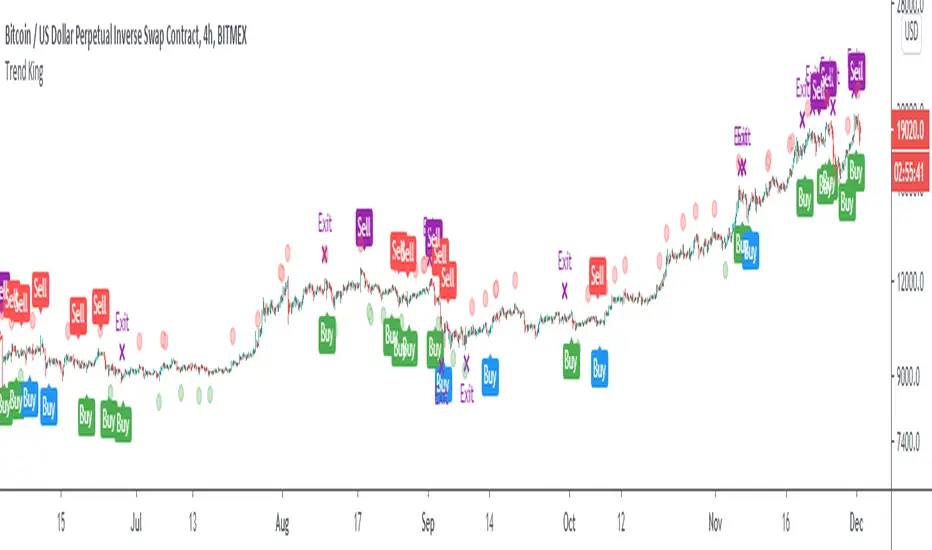
Trend KingIntroducing “Trend King”.
The alpha generating strategy built for Crypto.
“Trend King” combines 4 proprietary indicators. It buys and sells based on:
Short-term momentum
Long-term momentum
Volume compression
Volatility breakouts
The strategy was built on 2 years of BitMEX data (XBTUSD) and backtested on 9 years of Bitcoin data (BLX). Finally, the strategy was validated on multiple large market cap cryptocurrencies, including Ethereum (ETHUSD), without parameter adjustment.
Strategy backtesting checks include:
Used 0.12% fees. 60% more than the actual BitMex/Binance fees of 0.075%.
No Heikin-Ashi Candles (to avoid fake results)
No Stop-losses (to avoid fake order execution)
Market Orders Only (to avoid fake order execution)
The results speak for them self.
See the positive excess return from the “Trend King” strategy returns versus a simple Bitcoin “Buy-and-Hold” strategy. Best functionality on the Daily and 4HR timeframes.
**For Access: Contact me on TradingView or Twitter.
Alpha-Decreasing Exponential Moving AverageThe alpha parameter of this moving average decreases with every new bar on the chart, so it will become more slowly and slowly in course of time. Can act like additional support/resistance line but works in an acceptable way on weekly and monthly timeframes only.

ALPHA: VolumePLEASE READ THE ENTIRE POST BEFORE PURCHASING & USING THE ALPHA: Volume INDICATOR. Saves you and me some time in emails and messages. :)
Volume is the only true predictive method for an assets movement.
Most of my followers know I am volume-obsessed, volume precedes price and identifying major spikes in volume prior to an assets movement is one of the most valuable finds a trader can accomplish. I have spent more time studying volume then any other analysis technique. During this time I have become frustrated time and time again with the inefficiencies our typical volume indicators produce. We have the old bar volume indicator everyone sees on their charts, OBV, CMF, Accumulation/Distribution, MFI etc. etc., the list goes on. I have my favorites that I have written about in past publications, but none provide a real time volume view to my liking.
Frustration has led me to create something I truly believe is groundbreaking.... And it wasn't easy, by any means.
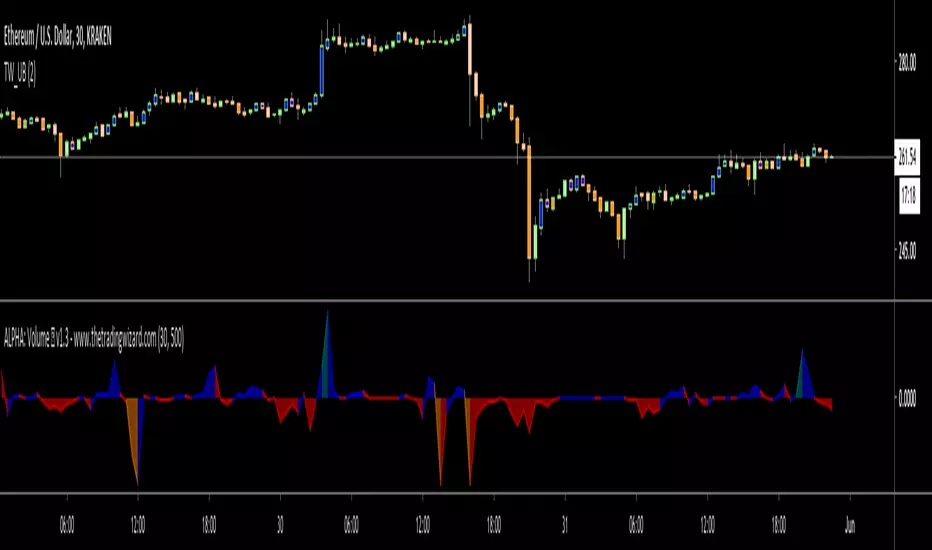
ALPHA: Volume
The ALPHA series is a suite of indicators designed to improve analysis and past analysis techniques. The ALPHA: Volume provides real time volume in addition to identifying major positions and true visibility into where and when positions are being taken. Being able to consistently identify these qualities creates an invaluable edge on the market.
The average buyer of assets are a drop in the bucket in terms of how they impact daily transactions (volume) compared to institutional buyers. The institutional buyers typically buy in large blocks. When institutional buyers get into the market, they cause significant increase in demand. Like any case of supply and demand, when demand increases and supply stays the same, price will increase. When an asset becomes desirable, it is more likely that supply may decrease (as current holders will be less willing to sell) which will cause even more price pressure.
Based on this volume precedes price analysis, it is probably obvious that there is a herd mentality when it comes to the market. When one institution is buying a large block of an asset, other institutions will spot the buying and be motivated to jump in as well. This increases the pressure on the assets price. You and I are small investors so it is important to join the herd and let the supply and demand caused by the institutions carry our investments higher.
Introduction
It's fairly simple to read, the default settings show an area with breaks view meaning positive and negative values, this is useful for seeing trends, pressure, and measuring divergences. Additionally, there is coloring to keep an eye on. To keep it simple:
Blue: Buying
Red: Selling
Teal: Heavy buying/major positions being taken.
Orange: Heavy selling/major positions being taken.
Let's get into what ALPHA: Volume does, it has numerous capabilities that I am still discovering, identifying false rallies/sell offs, telegraphing major moves, identifying underwater positions, spotting divergences, bottoms, tops and on and on. One thing to note that it doesn't do is show cumulative volume such as the OBV, this can be useful for identifying rising wedges and similar patterns, I will no longer be using other volume indicators unless I am identifying a pattern that is reliant on cumulative volume.
In this example below, we see heavy selling causing a dip that was then bought up with major positions causing a rally because demand exceeded supply.
The next example shows large positions being taken drying up supply ultimately causing a rally, very well telegraphed.
Same scenario but heavy selling weakening demand.
Originally, I planned on going on and on with examples, but I am going to keep this simple & short as I don't want to prolong the publishing. This will sell itself as more people discover the quality and accuracy. Still not sold? No worries, I'll be doing all of my volume analysis off of this indicator, so stay tuned for more in depth analysis with it on TradingView and twitter, I am truly excited for this indicator to be used by traders and analysts. Those of you that purchase and use it, (already orders off of my site and I haven't even published this) feel free to tag me in a tweet with a chart if you have questions, there will be times when volume is not making sense and perhaps I can offer insight into what is happening.
Conclusion
Before I get messages, "But Nick, the volume indicator was wrong here!".... No it wasn't, its not a signal generator, it is measuring real time volume. I cannot fix peoples' faulty positions that the indicator is showing. Volume should never be used independent of price action & other forms of analysis to determine buying or selling patterns. Volume is extremely important as a confirmation for technical indicators and I strongly suggest you use it as such. I will be doing several videos on this over the next couple weeks on my youtube channel showing ways to confirm other indicators with volume. Ichimoku goes great with it btw :).
Please note this works on all assets on all time frames, during my volume studies with this indicator I noticed lots of noise depending on the time frame, so I have implemented a feature that automatically adjusts to the correct settings based on what time frame you are on. I added a masking feature to keep my work proprietary that shows 30 and 500 (not true) as the settings in case my formula is ever figured out (doubtful but the capitalist in me that believes it is ok to protect what you work for) If you uncheck "Use Preset Periods" in settings then it will allow you to adjust the periods and peak limit, I don't recommend playing around with the settings as you can disturb the balance I've found. However, the option is there for the analysts that are into experimenting. If you feel the need to adjust some things then peak limit is the only thing I recommend adjusting, it allows you to view higher parameter limits on the volume spike to measure divergences of very large orders, the peak limit doesn't matter so much as long as it indicates the teal or orange, some spikes go as high as 80K in testing. In the end the size is typically irrelevant, but it is there in case you want to measure it or have curiosity.
I want to provide research and discoveries from its users and myself on a regular basis. I will be holding discussions & providing research in my discord server that I run with a team of very talented analysts. The link for that is here: discord.gg
This indicator is available for TradingView users on my web site www.thetradingwizard.com for $99, that includes a life time subscription. There is also a monthly subscription option for all three indicators from the ALPHA series. (Please see my published scripts for information on the other two) Both purchase options include updates and support as a user.
This will be the end of the ALPHA indicator series for a while, after finally conquering volume I am moving on with the formulas from the ALPHA series to bigger things. Enjoy!
Disclaimer
Nothing in this post is to be used or construed as financial advice. The indicator is not a signal-generating indicator and should not be used to trade off of solely. This post is meant as an educational post to explain the functions of the indicator.
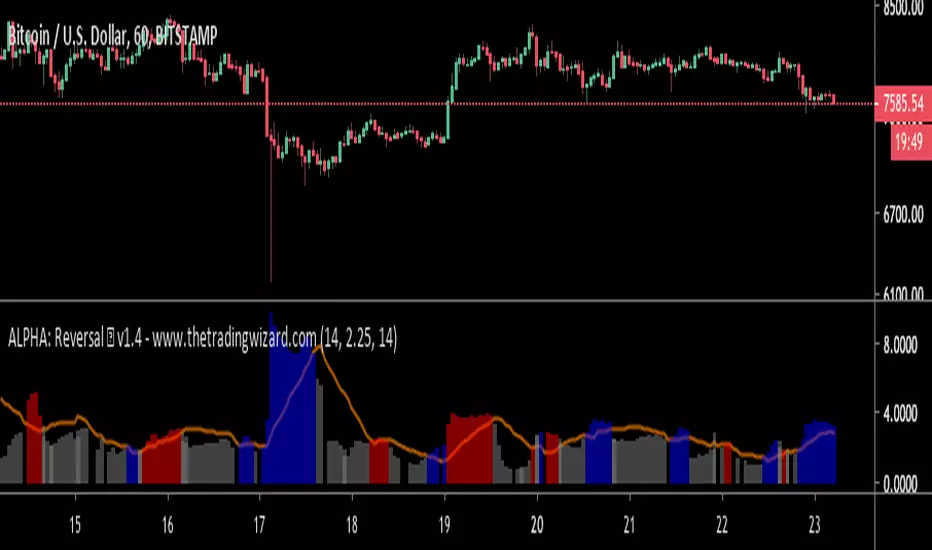
ALPHA: ReversalWhat is a divergence?
In the case of strength and momentum indicators, it is when the price deviates from the movement of the oscillator, it can have significant implications for trade management.
Divergences in an uptrend occurs when the price makes a higher high but the indicator does not. In a downtrend, divergence occurs when the price makes a lower low, but the indicator does not. When a divergence is spotted, there is a higher probability of a price reversal.
Divergences helps the trader recognize and react appropriately to a change in price action. It tells us something is changing and the trader must make a decision, such as tighten the stop-loss or take profit. Seeing divergences increases profitability by alerting the trader to protect profits or open a position.
Divergences indicate that something is changing, but it does not automatically mean the trend will reverse. It signals the trader must consider holding, tightening the stop loss, opening a position or take profit.
Introduction
The Alpha: Reversal is an indicator based off of the Stochastic, Relative Strength Index and Momentum indicator. Its sole purpose is to be able to identify divergences when they matter and identify high probability reversal areas. The formula used between the three indicators will be kept proprietary, in addition to the slight changes made on the Stochastic formula. The indicator plots the histogram with a divergence formula within a 14 period look-back on default. Additionally, there is a moving average of the histograms movement to identify the divergences when they matter.
Divergences exist on just about every candle, most of the time they are at a minuscule level. Rarely do the price and oscillator movement collude, the question becomes when do these divergences matter?
With that in mind I approached the task of finding a reliable reversal model. On default, the indicator has a moving average that measures the past histogram (the formula of the three indicators) movement to identify when a high potential trend shift may happen.
Keeping volatility in mind there is a feature called "Fixed Threshold" in settings. Various assets move at different speeds, so the indicator needs the ability to adjust to fit the assets speed. This "Threshold" option does not have a set of rules to use for each asset, the option is there though, so it may be adjusted by the analyst manually if the histogram moving average seems inaccurate due to volatility or lack thereof. In future publications (or possibly indicator updates) I plan on expanding on a fixed set of rules for various assets. This will take considerable time to research and backtest the various values needed for an asset's speed, so for now the default MA can be used until you are comfortable with adjusting the threshold level manually.
The look-back period on the histogram and threshold MA can be adjusted to whichever time period you would like. However, the default 14 is typically what is best considering the inputs of the three underlying indicators.
Analysis
The indicator is actually quite simple to read. When the price spikes blue, there is a high probability of reversal, same goes for red but in the opposite fashion. Now as always, you should use this indicator as an analysis tool and not rely on it by itself. Many times Cryptocurrencies couldn't care less about strength or oversold/overbought and volume explodes out of nowhere, I highly recommend you use price action in addition to Alpha: Exhaustion and Alpha: Volume with this tool. Oh wait, Alpha: Volume is not out yet.... SOON. :)
Point is, use proper analysis techniques with this indicator, nothing is perfect. NOTHING. But the Alpha: Reversal is a great tool to use for not only the beginner trader, but the advanced also. There is a ton of ways to use this indicator beyond the high probability reversal areas, I am discovering some really neat patterns within my new formula that I plan on expanding on in future publications, i.e. dead cat bounces and relief candles plus a few more.
Conclusion
The Alpha: Reversal is a great analysis tool that I now use on all my charts, as time goes on I plan on holding classes for its users on a regular basis to expand on the various techniques that can be implemented in addition to publishing research relevant to its purpose.
Access to the indicator can be purchased on my site www.thetradingwizard.com with either a monthly option for this & the Alpha: Exhaustion (), or a lifetime subscription independently. All updates and changes will be done automatically and included for every user. The Alpha series is designed to help you make your analysis easier to comprehend and more accurate, I really think this one will be enjoyed by many for years to come, I have enjoyed designing and using this immensely. As always, please make your own decisions when trading and use proper analysis techniques.
Note: The options within the Alpha: Reversal allow the indicator to be used on any timeframe & any asset. As with any indicator, the higher the timeframe, the higher the accuracy.
Disclaimer
Nothing in this post is to be used or construed as financial advice. This post is meant as an educational post to explain the functions of the indicator.
Alpha-Sutte ModelThe Alpha-Sutte model is an ongoing project run by Ansari Saleh Ahmar, a lecturer and researcher at Universitas Negeri Makassar in Indonesia, that attempts to make forecasts for time series like how Arima and Holt-Winters models do. Currently Ahmar and his team have conducted research and published papers comparing the efficacy of the Alpha-Sutte and other models, such as Arima and Holt-Winters, on topics ranging from forecasting Turkey's CPI data, Bitcoin prices, Apple's stock prices, primary energy supply of Indonesia, to infant mortality rates in China.
The Alpha-Sutte model in comparison to the other two models listed above shows promise in providing a more accurate forecast, and the project has been able to receive some of its funding from organizations such as the US Agency for International Development, which is a part of the US Federal Government, so maybe the project has some actual merit.
How it works:
In this model there are four values presented at the top of the window.
1) The first value in blue is the value of the Alpha-Sutte model whose purpose is to forecast the price of the current bar.
2) The second value in yellow is an adaptive version of the Alpha-Sutte model that I made. The purpose of the adaptive Alpha-Sutte model is to expand upon the Alpha-Sutte by allowing new information to be introduced, causing the value to change during the current period, hence the adaptiveness of it.
3) The third value in aqua is the moving average of the low% Sutte line which is a predictive line that is based off of the close and low of the current and previous periods.
4) The fourth value in red is the moving average of the high% Sutte line which is a predictive line that is based off of the close and high of the current and previous periods.
Trend signals:
If low% Sutte (aqua value/line) is greater than high% Sutte (red value/line) then this is a buy signal.
If high% Sutte (red value/line) is greater than low% Sutte (aqua value/line) then this is a sell signal.
Caveat:
Even though this model's purpose is to forecast the future, will it be able to predict periods of large movements? No, of course not, but it will adjust quickly to try to make more accurate forecasts for the next period. This was also a reason why I made an adaptive version of this model to try to reduce some of the discrepancies between the Alpha Sutte and price when there is a large unexpected move.
*WARNING before using this I would highly recommend that you look up "Sutte Indicator" online and read some of the papers about this model before you use this , even though this model has shown merit when compared to Arima and Holt-Winter models this is still an ongoing project.*
Hopefully this project will actually come to something in the near future as the calculation for this time series predictive model is much easier to calculate and program in pine editor than something like an Arima model.
*Also, if you know how to use R language there is a package for the "Alpha-Sutte model".*

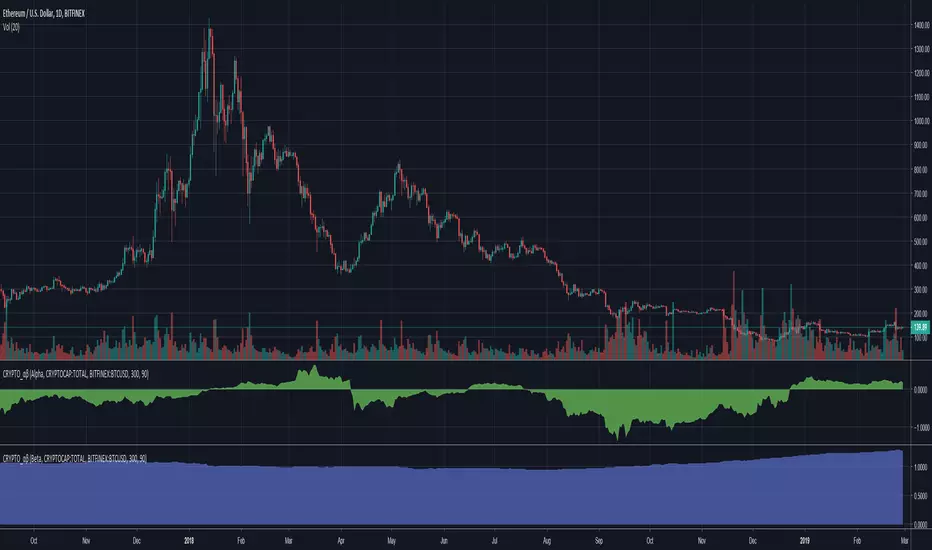
Cryptocurrency α / β (Alpha and Beta)Alpha and Beta for cryptocurrency. Custom input for other symbols.
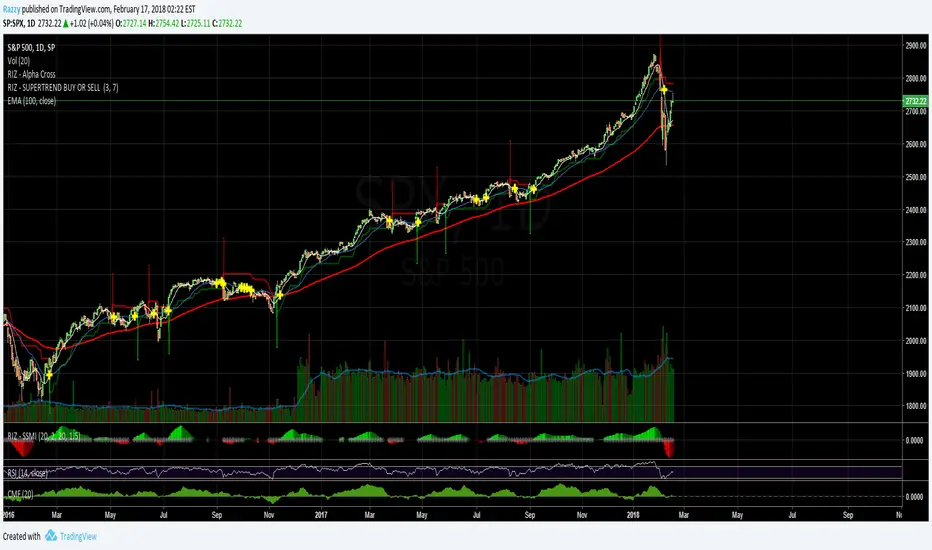
RIZ - ALPHA CROSS EVO - FOR TEAM & STUDENTS ONLYThis is the newest version of the Riz Alpha Cross. It is an evolution of the previous version, hence the "EVO" moniker. This indicator is to be used for entries only and is only available to the Riz International Team and Students.
you can find out more about here.

[NG] Indicator - Altcoin Alpha - v1(Created for Client)
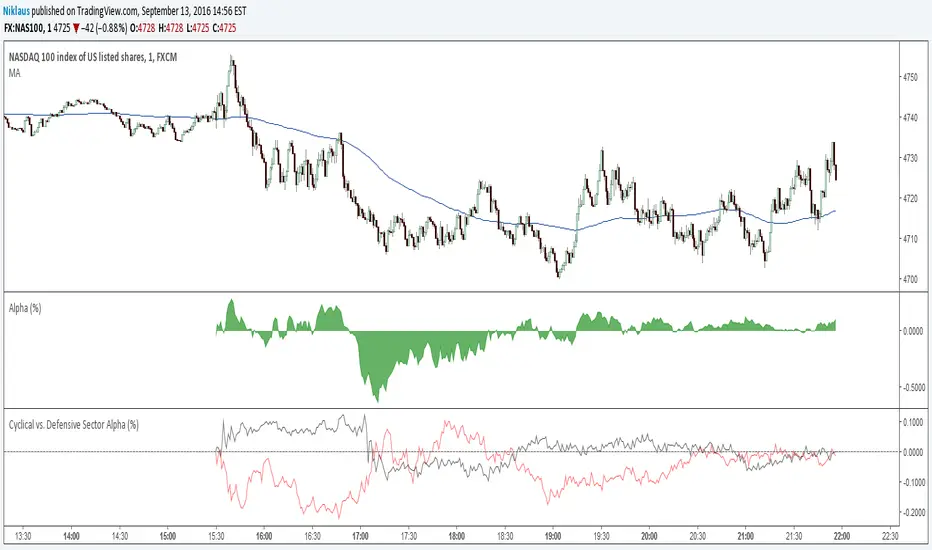
Alpha (Unique price action of asset) indicator for ALTcoins implementation, taking `BINANCE:BTCUSDT` as the market reference. Can be improved by adding more BTC charts from more sources, so as to get a unified chart of BTC for market representation.
Set `alpha period` to a value, wherein you want to see the unique price action of the asset. For short term trend, a value of 24 is good for `1H` charts (1 day), and value of 168 is good for long term trends on `1H` charts (1 week trend).
Corresponding values of `beta period` should be `168` (1 week for 1 day alpha) and `720` (1 month for 1 week alpha period).
You can set `alpha` and `beta` period as per your requirements.
Regards,

RIZ - Alpha Cross - Updated Version & For Students OnlyThis is the updated version of the RIZ - Alpha Cross indicator/overlay.
it is ONLY available to Riz International Stock Trading Mentoring Students.
You can check out our website to see what we offer:
rizinternational.com
Thanks,
Riz

Riz International - Alpha CrossThe Riz International - Alpha Cross indicator/overlay is meant to be used as a ENTRY signal ONLY. It works on all asset classes and on all time periods. The Alpha Cross works best on daily charts and in trending markets.

Riz International - Alpha CrossThe Riz International - Alpha Cross indicator/overlay is meant to be used as a ENTRY signal ONLY. It works on all asset classes and on all time periods. Works best on daily charts and in trending markets.
420_alphaA newer, more polished (aka less buggy), and updated version of the holy grail script I published for silver before.
This script is a work in progress (as was the last version) and although I have been trying to refine this script I would still only classify it in the early stages of development; unlike my previous Euro Dollar strength holy grail script which was designed to work with only the EU pair or the XAG spread script that was designed to work only with silver, this script is designed to work with ANY commodity traded in US dollars as this script also utilizes my holy grail basket method to determine the true strength of any commodity in terms of USD.

Cyclical vs. Defensive Sector Alphashows mean excess returns of defensive and cyclical sectors vs. S&P500

Alpha strategy - simple versionThis Strategy goes long when Sharpe Ratio is > 1 and Alpha against the S&P500 is generated. It exits when conditions break away. en.wikipedia.org(finance). Use on daily or 5min.

Betaen.wikipedia.org(finance)
Beta is a measure of the risk arising from exposure to general market movements as opposed to idiosyncratic factors.
The market portfolio of all investable assets has a beta of exactly 1 (here the S&P500). A beta below 1 can indicate either an investment with lower volatility than the market, or a volatile investment whose price movements are not highly correlated with the market

Alpha strategyUSE ON DAILY TIMEFRAME TO DETECT MOMO STOCKS & ETFs AND TRADE THEM
This Strategy goes long when Sharpe Ratio is > 1 and Alpha against the S&P500 is generated. It exits when conditions break away. Strategy can be adapted to run intraday, it however needs different (lower) trigger levels.
examples to try this on: GER30, NAS100, JPN225, AAPL, IBB, TSLA, etc.

AlphaAlpha is a measure of the active return on an investment, the performance of that investment compared to the S&P500 index, where 0.01 = 1%
alpha < 0: the investment has earned too little for its risk (or, was too risky for the return)
alpha = 0: the investment has earned a return adequate for the risk taken
alpha > 0: the investment has a return in excess of the reward for the assumed risk
