BTC - Satoshis Altcoin Graveyard OVERVIEW
The Satoshi's Altcoin Graveyard (SAG) is a macro-statistical engine designed to solve the problem of Survivorship Bias . It is a well-known phenomenon in the crypto markets that the "Top 10" list is in a constant state of flux. If you look at historical data from CoinMarketCap (CMC) year by year, you will see a revolving door of projects that once seemed "too big to fail" disappearing into obscurity. Meanwhile, Bitcoin has remained the undisputed #1 since inception.
While most traders have a "gut feeling" that Altcoins eventually depreciate against Bitcoin, I believe in measuring it and drawing it on a chart for better visibility. By locking in specific "Cohorts" of market leaders from the past, we can track their inevitable decay through the Satoshi Sieve .
THE 13-COIN STATISTICAL BUCKET
To ensure an objective, non-biased audit, each cohort (we look at 2018, 2020 and 2022) is constructed using a fixed market-cap methodology from the snapshot date (excluding stablecoins):
• The Core: The Top 10 non-stablecoin assets at that time by Marketcap.
• The Risk Alpha: Representative samples from the Top #25, #50, and #100 ranks. (By including lower-ranked "riskier" alts, we capture the full statistical decay of the market, not just the "Blue Chips.")
TECHNICAL ARCHITECTURE
This script is engineered to push the boundaries of the Pine Script engine. TradingView enforces a hard limit of 40 unique data requests . By tracking 3 cohorts of 13 assets plus the Bitcoin base, this indicator utilizes exactly 40/40 requests , providing the maximum possible data density in a single chart window.
THE SPS CONCEPT (Survival Probability Score)
The SPS measures the Breadth of Survival . It answers: "How many coins from this year (the year of the snapshot) are actually outperforming BTC?"
We use a binary logic system to determine if a coin is "Winning" or "Losing" against the only benchmark that matters: Bitcoin.
• The Status Formula: Status = Current_Alt_BTC_Ratio >= Entry_Alt_BTC_Ratio ? 1 : 0 . This means: Every single day, at the Daily Close , the script compares the current Alt/BTC ratio to the fixed ratio from the snapshot date. If the coin is worth more in Bitcoin today than it was back then, it is assigned a "1" (a Win). If it has lost value against Bitcoin, it gets a "0" (a Loss).
• The SPS Line: SPS Line = (Sum of 'Wins' / 13) * 100 This means: We add up all the "Winners" for that specific day and turn it into a percentage. For example, if the Aqua line is at 7.69% on your chart, it confirms that on that day , exactly 1 out of the 13 coins was successfully beating Bitcoin, while the other 12 were underperforming.
THE PERFORMANCE MATRIX
In the top-right corner, we provide a Weighted Portfolio Simulation . This answers the financial question: "If I swapped 1 BTC into an equal-weight basket of these 13 coins on the snapshot day, what is my BTC value today?".
• Value < 1.0 BTC: You lost purchasing power compared to holding Bitcoin.
• Value > 1.0 BTC: You successfully achieved "Alpha" over the benchmark.
HOW TO READ THE CHART
• The Waterfall: Lines generally trend downward as the "Satoshi Sieve" filters out assets that cannot maintain their BTC-relative value.
• Dynamic Winners: We dynamically print the names of the current survivors at the tip of each line. If a cohort shows "None," the graveyard is full.
HOW TO READ THE MATRIX
• The BTC Target: Any portfolio value in the matrix below 1.0 BTC represents a failed altcoin rotation.
• Class of 2018: A portfolio value near 0.15 BTC at the current date, means a 85% loss rate.
• Class of 2020: A portfolio value near 0.77 BTC at the current date, means an approx 20 % loss rate.
• Class of 2022: A portfolio value near 0.31 BTC at the current date, means an approx 70% loss rate.
DIFFERENCE FROM AN ALTCOIN INDEX
Standard Altcoin Indexes (like my ALSI Index ) "rebalance" by removing losers and adding new winners. This is deceptive. The Altcoin Graveyard never rebalances . It forces you to watch the "losers" decay, providing a realistic look at the long-term opportunity cost of "Buy and Hold" for anything other than Bitcoin.
CONCLUSION
The data revealed by the Satoshi Sieve leads to a singular, sobering "Lesson Learned": Picking the right coin to outperform Bitcoin is not just difficult—it is statistically improbable over a long-term horizon.
While the "Risk-Reward" of altcoins is often marketed as having higher upside, the Altcoin Graveyard proves that for the vast majority of assets, the reward does not justify the risk of total portfolio erosion in BTC terms.
• The Mathematical Odds: If you picked a Top 10 coin in 2018, your chance of outperforming BTC today is effectively 0%.
• The Rotation Trap: Most investors "HODL" these assets into the graveyard, hoping for a return to previous ATHs that never comes because the liquidity has already moved on to the next "Class" of winners.
The final conclusion is clear: Diversification into altcoins is often just a slow-motion transfer of wealth back to Bitcoin. If you cannot identify the 1-out-of-13 that survives the Sieve, your best risk-adjusted move has historically been to simply hold the benchmark.
DISCLAIMER
This script is for educational purposes only. It does not constitute financial advice. It is a mathematical study of historical opportunity cost and survivorship bias.
Tags
bitcoin, btc, satoshis graveyard, altseason, dominance, total3, rotation, cycle, index, alsi, Rob Maths, robmaths
Altcoin

Mutanabby_AI | ONEUSDT_MR1
ONEUSDT Mean-Reversion Strategy | 74.68% Win Rate | 417% Net Profit
This is a long-only mean-reversion strategy designed specifically for ONEUSDT on the 1-hour timeframe. The core logic identifies oversold conditions following sharp declines and enters positions when selling pressure exhausts, capturing the subsequent recovery bounce.
Backtested Period: June 2019 – December 2025 (~6 years)
Performance Summary
| Metric | Value |
|--------|-------|
| Net Profit | +417.68% |
| Win Rate | 74.68% |
| Profit Factor | 4.019 |
| Total Trades | 237 |
| Sharpe Ratio | 0.364 |
| Sortino Ratio | 1.917 |
| Max Drawdown | 51.08% |
| Avg Win | +3.14% |
| Avg Loss | -2.30% |
| Buy & Hold Return | -80.44% |
Strategy Logic :
Entry Conditions (Long Only):
The strategy seeks confluence of three conditions that identify exhausted selling:
1. Prior Move Filter:*The price change from 5 bars ago to 3 bars ago must be ≥ -7% (ensures we're not entering during freefall)
2. Current Move Filter: The price change over the last 2 bars must be ≤ 0% (confirms momentum is stalling or reversing)
3. Three-Bar Decline: The price change from 5 bars ago to 3 bars ago must be ≤ -5% (confirms a significant recent drop occurred)
When all three conditions align, the strategy identifies a potential reversal point where sellers are exhausted.
Exit Conditions:
- Primary Exit: Close above the previous bar's high while the open of the previous bar is at or below the close from 9 bars ago (profit-taking on strength)
- Trailing Stop: 11x ATR trailing stop that locks in profits as price rises
Risk Management
- Position Sizing:Fixed position based on account equity divided by entry price
- Trailing Stop:11× ATR (14-period) provides wide enough room for crypto volatility while protecting gains
- Pyramiding:Up to 4 orders allowed (can scale into winning positions)
- **Commission:** 0.1% per trade (realistic exchange fees included)
Important Disclaimers
⚠️ This is NOT financial advice.
- Past performance does not guarantee future results
- Backtest results may contain look-ahead bias or curve-fitting
- Real trading involves slippage, liquidity issues, and execution delays
- This strategy is optimized for ONEUSDT specifically — results may differ on other pairs
- Always test before risking real capital
Recommended Usage
- Timeframe:*1H (as designed)
- Pair: ONEUSDT (Binance)
- Account Size: Ensure sufficient capital to survive max drawdown
Source Code
Feedback Welcome
I'm sharing this strategy freely for educational purposes. Please:
- Drop a comment with your backtesting results any you analysis
- Share any modifications that improve performance
- Let me know if you spot any issues in the logic
Happy trading
As a quant trader, do you think this strategy will survive in live trading?
Yes or No? And why?
I want to hear from you guys

ALT Risk Metric StrategyHere's a professional write-up for your ALT Risk Strategy script:
ALT/BTC Risk Strategy - Multi-Crypto DCA with Bitcoin Correlation Analysis
Overview
This strategy uses Bitcoin correlation as a risk indicator to time entries and exits for altcoins. By analyzing how your chosen altcoin performs relative to Bitcoin, the strategy identifies optimal accumulation periods (when alt/BTC is oversold) and profit-taking opportunities (when alt/BTC is overbought). Perfect for traders who want to outperform Bitcoin by strategically timing altcoin positions.
Key Innovation: Why Alt/BTC Matters
Most traders focus solely on USD price, but Alt/BTC ratios reveal true altcoin strength:
When Alt/BTC is low → Altcoin is undervalued relative to Bitcoin (buy opportunity)
When Alt/BTC is high → Altcoin has outperformed Bitcoin (take profits)
This approach captures the rotation between BTC and alts that drives crypto cycles
Key Features
📊 Advanced Technical Analysis
RSI (60% weight): Primary momentum indicator on weekly timeframe
Long-term MA Deviation (35% weight): Measures distance from 150-period baseline
MACD (5% weight): Minor confirmation signal
EMA Smoothing: Filters noise while maintaining responsiveness
All calculations performed on Alt/BTC pairs for superior market timing
💰 3-Tier DCA System
Level 1 (Risk ≤ 70): Conservative entry, base allocation
Level 2 (Risk ≤ 50): Increased allocation, strong opportunity
Level 3 (Risk ≤ 30): Maximum allocation, extreme undervaluation
Continuous buying: Executes every bar while below threshold for true DCA behavior
Cumulative sizing: L3 triggers = L1 + L2 + L3 amounts combined
📈 Smart Profit Management
Sequential selling: Must complete L1 before L2, L2 before L3
Percentage-based exits: Sell portions of position, not fixed amounts
Auto-reset on re-entry: New buy signals reset sell progression
Prevents premature full exits during volatile conditions
🤖 3Commas Automation
Pre-configured JSON webhooks for Custom Signal Bots
Multi-exchange support: Binance, Coinbase, Kraken, Bitfinex, Bybit
Flexible quote currency: USD, USDT, or BUSD
Dynamic order sizing: Automatically adjusts to your tier thresholds
Full webhook documentation compliance
🎨 Multi-Asset Support
Pre-configured for popular altcoins:
ETH (Ethereum)
SOL (Solana)
ADA (Cardano)
LINK (Chainlink)
UNI (Uniswap)
XRP (Ripple)
DOGE
RENDER
Custom option for any other crypto
How It Works
Risk Metric Calculation (0-100 scale):
Fetches weekly Alt/BTC price data for stability
Calculates RSI, MACD, and deviation from 150-period MA
Normalizes MACD to 0-100 range using 500-bar lookback
Combines weighted components: (MACD × 0.05) + (RSI × 0.60) + (Deviation × 0.35)
Applies 5-period EMA smoothing for cleaner signals
Color-Coded Risk Zones:
Green (0-30): Extreme buying opportunity - Alt heavily oversold vs BTC
Lime/Yellow (30-70): Accumulation range - favorable risk/reward
Orange (70-85): Caution zone - consider taking initial profits
Red/Maroon (85-100+): Euphoria zone - aggressive profit-taking
Entry Logic:
Buys execute every candle when risk is below threshold
As risk decreases, position sizing automatically scales up
Example: If risk drops from 60→25, you'll be buying at L1 rate until it hits 50, then L2 rate, then L3 rate
Exit Logic:
Sells only trigger when in profit AND risk exceeds thresholds
Sequential execution ensures partial profit-taking
If new buy signal occurs before all sells complete, sell levels reset to L1
Configuration Guide
Choosing Your Altcoin:
Select crypto from dropdown (or use CUSTOM for unlisted coins)
Pick your exchange
Choose quote currency (USD, USDT, BUSD)
Risk Metric Tuning:
Long Term MA (default 150): Higher = more extreme signals, Lower = more frequent
RSI Length (default 10): Lower = more volatile, Higher = smoother
Smoothing (default 5): Increase for less noise, decrease for faster reaction
Buy Settings (Aggressive DCA Example):
L1 Threshold: 70 | Amount: $5
L2 Threshold: 50 | Amount: $6
L3 Threshold: 30 | Amount: $7
Total L3 buy = $18 per candle when deeply oversold
Sell Settings (Balanced Exit Example):
L1: 70 threshold, 25% position
L2: 85 threshold, 35% position
L3: 100 threshold, 40% position (final exit)
3Commas Setup
Bot Configuration:
Create Custom Signal Bot in 3Commas
Set trading pair to your altcoin/USD (e.g., ETH/USD, SOL/USDT)
Order size: Select "Send in webhook, quote" to use strategy's dollar amounts
Copy Bot UUID and Secret Token
Script Configuration:
Paste credentials into 3Commas section inputs
Check "Enable 3Commas Alerts"
Save and apply to chart
TradingView Alert:
Create Alert → Condition: "alert() function calls only"
Webhook URL: api.3commas.io
Enable "Webhook URL" checkbox
Expiration: Open-ended
Strategy Advantages
✅ Outperform Bitcoin: Designed specifically to beat BTC by timing alt rotations
✅ Capture Alt Seasons: Automatically accumulates when alts lag, sells when they pump
✅ Risk-Adjusted Sizing: Buys more when cheaper (better risk/reward)
✅ Emotional Discipline: Systematic approach removes fear and FOMO
✅ Multi-Asset: Run same strategy across multiple altcoins simultaneously
✅ Proven Indicators: Combines RSI, MACD, and MA deviation - battle-tested tools
Backtesting Insights
Optimal Timeframes:
Daily chart: Best for backtesting and signal generation
Weekly data is fetched internally regardless of display timeframe
Historical Performance Characteristics:
Accumulates heavily during bear markets and BTC dominance periods
Captures explosive altcoin rallies when BTC stagnates
Sequential selling preserves capital during extended downtrends
Works best on established altcoins with multi-year history
Risk Considerations:
Requires capital reserves for extended accumulation periods
Some altcoins may never recover if fundamentals deteriorate
Past correlation patterns may not predict future performance
Always size positions according to personal risk tolerance
Visual Interface
Indicator Panel Displays:
Dynamic color line: Green→Lime→Yellow→Orange→Red as risk increases
Horizontal threshold lines: Dashed lines mark your buy/sell levels
Entry/Exit labels: Green labels for buys, Orange/Red/Maroon for sells
Real-time risk value: Numerical display on price scale
Customization:
All threshold lines are adjustable via inputs
Color scheme clearly differentiates buy zones (green spectrum) from sell zones (red spectrum)
Line weights emphasize most extreme thresholds (L3 buy and L3 sell)
Strategy Philosophy
This strategy is built on the principle that altcoins move in cycles relative to Bitcoin. During Bitcoin rallies, alts often bleed against BTC (high sell, accumulate). When Bitcoin consolidates, alts pump (take profits). By measuring risk on the Alt/BTC chart instead of USD price, we time these rotations with precision.
The 3-tier system ensures you're always averaging in at better prices and scaling out at better prices, maximizing your Bitcoin-denominated returns.
Advanced Tips
Multi-Bot Strategy:
Run this on 5-10 different altcoins simultaneously to:
Diversify correlation risk
Capture whichever alt is pumping
Smooth equity curve through rotation
Pairing with BTC Strategy:
Use alongside the BTC DCA Risk Strategy for complete portfolio coverage:
BTC strategy for core holdings
ALT strategies for alpha generation
Rebalance between them based on BTC dominance
Threshold Calibration:
Check 2-3 years of historical data for your chosen alt
Note where risk metric sat during major bottoms (set buy thresholds)
Note where it peaked during euphoria (set sell thresholds)
Adjust for your risk tolerance and holding period
Credits
Strategy Development & 3Commas Integration: Claude AI (Anthropic)
Technical Analysis Framework: RSI, MACD, Moving Average theory
Implementation: pommesUNDwurst
Disclaimer
This strategy is for educational purposes only. Cryptocurrency trading involves substantial risk of loss. Altcoins are especially volatile and many fail completely. The strategy assumes liquid markets and reliable Alt/BTC price data. Always do your own research, understand the fundamentals of any asset you trade, and never risk more than you can afford to lose. Past performance does not guarantee future results. The authors are not financial advisors and assume no liability for trading decisions.
Additional Warning: Using leverage or trading illiquid altcoins amplifies risk significantly. This strategy is designed for spot trading of established cryptocurrencies with deep liquidity.
Tags: Altcoin, Alt/BTC, DCA, Risk Metric, Dollar Cost Averaging, 3Commas, ETH, SOL, Crypto Rotation, Bitcoin Correlation, Automated Trading, Alt Season
Feel free to modify any sections to better match your style or add specific backtesting results you've observed! 🚀Claude is AI and can make mistakes. Please double-check responses. Sonnet 4.5

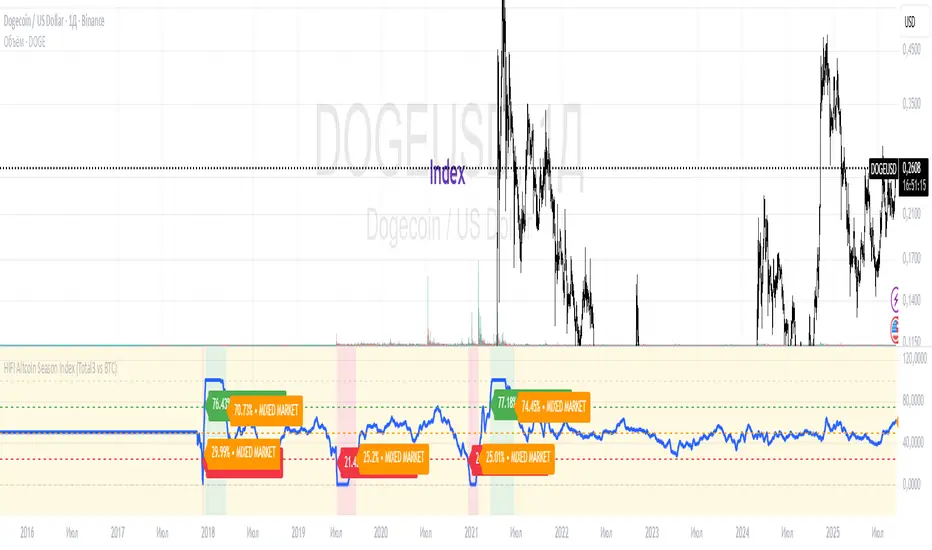
HIFI Altcoin Season Index (Total3 vs BTC)This indicator helps you determine whether the crypto market is in an "altcoin season" or a "bitcoin season." It doesn't compare every single altcoin to Bitcoin individually; instead, it uses a more efficient approach.
Methodology
The index calculates the difference in price performance over a selected period (default 90 days) between the total market capitalization of altcoins without Ethereum (TOTAL3) and Bitcoin (BTC).
Interpretation
Value above 75: TOTAL3 is showing significantly stronger growth than BTC, indicating an ALTCOIN SEASON. 🚀
Value below 25: BTC is outperforming TOTAL3, indicating a BITCOIN SEASON. 👑
Value between 25 and 75: The market is in a mixed or neutral phase. 🤷
Benefits
This method avoids the technical limitations of Pine Script when requesting data for a large number of symbols, making the indicator stable and reliable.
Disclaimer: This indicator is a tool for market analysis and should not be considered financial advice.
AltCoin & MemeCoin Index Correlation [Eddie_Bitcoin]🧠 Philosophy of the Strategy
The AltCoin & MemeCoin Index Correlation Strategy by Eddie_Bitcoin is a carefully engineered trend-following system built specifically for the highly volatile and sentiment-driven world of altcoins and memecoins.
This strategy recognizes that crypto markets—especially niche sectors like memecoins—are not only influenced by individual price action but also by the relative strength or weakness of their broader sector. Hence, it attempts to improve the reliability of trading signals by requiring alignment between a specific coin’s trend and its sector-wide index trend.
Rather than treating each crypto asset in isolation, this strategy dynamically incorporates real-time dominance metrics from custom indices (OTHERS.D and MEME.D) and combines them with local price action through dual exponential moving average (EMA) crossovers. Only when both the asset and its sector are moving in the same direction does it allow for trade entries—making it a confluence-based system rather than a single-signal strategy.
It supports risk-aware capital allocation, partial exits, configurable stop loss and take profit levels, and a scalable equity-compounding model.
✅ Why did I choose OTHERS.D and MEME.D as reference indices?
I selected OTHERS.D and MEME.D because they offer a sector-focused view of crypto market dynamics, especially relevant when trading altcoins and memecoins.
🔹 OTHERS.D tracks the market dominance of all cryptocurrencies outside the top 10 by market cap.
This excludes not only BTC and ETH, but also major stablecoins like USDT and USDC, making it a cleaner indicator of risk appetite across true altcoins.
🔹 This is particularly useful for detecting "Altcoin Season"—periods where capital rotates away from Bitcoin and flows into smaller-cap coins.
A rising OTHERS.D often signals the start of broader altcoin rallies.
🔹 MEME.D, on the other hand, captures the speculative behavior of memecoin segments, which are often driven by retail hype and social media activity.
It's perfect for timing momentum shifts in high-risk, high-reward tokens.
By using these indices, the strategy aligns entries with broader sector trends, filtering out noise and increasing the probability of catching true directional moves, especially in phases of capital rotation and altcoin risk-on behavior.
📐 How It Works — Core Logic and Execution Model
At its heart, this strategy employs dual EMA crossover detection—one pair for the asset being traded and one pair for the selected market index.
A trade is only executed when both EMA crossovers agree on the direction. For example:
Long Entry: Coin's fast EMA > slow EMA and Index's fast EMA > slow EMA
Short Entry: Coin's fast EMA < slow EMA and Index's fast EMA < slow EMA
You can disable the index filter and trade solely based on the asset’s trend just to make a comparison and see if improves a classic EMA crossover strategy.
Additionally, the strategy includes:
- Adaptive position sizing, based on fixed capital or current equity (compound mode)
- Take Profit and Stop Loss in percentage terms
- Smart partial exits when trend momentum fades
- Date filtering for precise backtesting over specific timeframes
- Real-time performance stats, equity tracking, and visual cues on chart
⚙️ Parameters & Customization
🔁 EMA Settings
Each EMA pair is customizable:
Coin Fast EMA: Default = 47
Coin Slow EMA: Default = 50
Index Fast EMA: Default = 47
Index Slow EMA: Default = 50
These control the sensitivity of the trend detection. A wider spread gives smoother, slower entries; a narrower spread makes it more responsive.
🧭 Index Reference
The correlation mechanism uses CryptoCap sector dominance indexes:
OTHERS.D: Dominance of all coins EXCLUDING Top 10 ones
MEME.D: Dominance of all Meme coins
These are dynamically calculated using:
OTHERS_D = OTHERS_cap / TOTAL_cap * 100
MEME_D = MEME_cap / TOTAL_cap * 100
You can select:
Reference Index: OTHERS.D or MEME.D
Or disable the index reference completely (Don't Use Index Reference)
💰 Position Sizing & Risk Management
Two capital allocation models are supported:
- Fixed % of initial capital (default)
- Compound profits, which scales positions as equity grows
Settings:
- Compound profits?: true/false
- % of equity: Between 1% and 200% (default = 10%)
This is critical for users who want to balance growth with risk.
🎯 Take Profit / Stop Loss
Customizable thresholds determine automatic exits:
- TakeProfit: Default = 99999 (disabled)
- StopLoss: Default = 5 (%)
These exits are percentage-based and operate off the entry price vs. current close.
📉 Trend Weakening Exit (Scale Out)
If the position is in profit but the trend weakens (e.g., EMA color signals trend loss), the strategy can partially close a configurable portion of the position:
- Scale Position on Weak Trend?: true/false
- Scaled Percentage: % to close (default = 65%)
This feature is useful for preserving profits without exiting completely.
📆 Date Filter
Useful for segmenting performance over specific timeframes (e.g., bull vs bear markets):
- Filter Date Range of Backtest: ON/OFF
- Start Date and End Date: Custom time range
OTHER PARAMETERS EXPLANATION (Strategy "Properties" Tab):
- Initial Capital is set to 100 USD
- Commission is set to 0.055% (The ones I have on Bybit)
- Slippage is set to 3 ticks
- Margin (short and long) are set to 0.001% to avoid "overspending" your initial capital allocation
📊 Visual Feedback and Debug Tools
📈 EMA Trend Visualization
The slow EMA line is dynamically color-coded to visually display the alignment between the asset trend and the index trend:
Lime: Coin and index both bullish
Teal: Only coin bullish
Maroon: Only index bullish
Red: Both bearish
This allows for immediate visual confirmation of current trend strength.
💬 Real-Time PnL Labels
When a trade closes, a label shows:
Previous trade return in % (first value is the effective PL)
Green background for profit, Red for losses.
📑 Summary Table Overlay
This table appears in a corner of the chart (user-defined) and shows live performance data including:
Trade direction (yellow long, purple short)
Emojis: 💚 for current profit, 😡 for current loss
Total number of trades
Win rate
Max drawdown
Duration in days
Current trade profit/loss (absolute and %)
Cumulative PnL (absolute and %)
APR (Annualized Percentage Return)
Each metric is color-coded:
Green for strong results
Yellow/orange for average
Red/maroon for poor performance
You can select where this appears:
Top Left
Top Right
Bottom Left
Bottom Right (default)
📚 Interpretation of Key Metrics
Equity Multiplier: How many times initial capital has grown (e.g., “1.75x”)
Net Profit: Total gains including open positions
Max Drawdown: Largest peak-to-valley drop in strategy equity
APR: Annualized return calculated based on equity growth and days elapsed
Win Rate: % of profitable trades
PnL %: Percentage profit on the most recent trade
🧠 Advanced Logic & Safety Features
🛑 “Don’t Re-Enter” Filter
If a trade is closed due to StopLoss without a confirmed reversal, the strategy avoids re-entering in that same direction until conditions improve. This prevents false reversals and repetitive losses in sideways markets.
🧷 Equity Protection
No new trades are initiated if equity falls below initial_capital / 30. This avoids overleveraging or continuing to trade when capital preservation is critical.
Keep in mind that past results in no way guarantee future performance.
Eddie Bitcoin

Mutanabby_AI | ATR+ | Trend-Following StrategyThis document presents the Mutanabby_AI | ATR+ Pine Script strategy, a systematic approach designed for trend identification and risk-managed position entry in financial markets. The strategy is engineered for long-only positions and integrates volatility-adjusted components to enhance signal robustness and trade management.
Strategic Design and Methodological Basis
The Mutanabby_AI | ATR+ strategy is constructed upon a foundation of established technical analysis principles, with a focus on objective signal generation and realistic trade execution.
Heikin Ashi for Trend Filtering: The core price data is processed via Heikin Ashi (HA) methodology to mitigate transient market noise and accentuate underlying trend direction. The script offers three distinct HA calculation modes, allowing for comparative analysis and validation:
Manual Calculation: Provides a transparent and deterministic computation of HA values.
ticker.heikinashi(): Utilizes TradingView's built-in function, employing confirmed historical bars to prevent repainting artifacts.
Regular Candles: Allows for direct comparison with standard OHLC price action.
This multi-methodological approach to trend smoothing is critical for robust signal generation.
Adaptive ATR Trailing Stop: A key component is the Average True Range (ATR)-based trailing stop. ATR serves as a dynamic measure of market volatility. The strategy incorporates user-defined parameters (
Key Value and ATR Period) to calibrate the sensitivity of this trailing stop, enabling adaptation to varying market volatility regimes. This mechanism is designed to provide a dynamic exit point, preserving capital and locking in gains as a trend progresses.
EMA Crossover for Signal Generation: Entry and exit signals are derived from the interaction between the Heikin Ashi derived price source and an Exponential Moving Average (EMA). A crossover event between these two components is utilized to objectively identify shifts in momentum, signaling potential long entry or exit points.
Rigorous Stop Loss Implementation: A critical feature for risk mitigation, the strategy includes an optional stop loss. This stop loss can be configured as a percentage or fixed point deviation from the entry price. Importantly, stop loss execution is based on real market prices, not the synthetic Heikin Ashi values. This design choice ensures that risk management is grounded in actual market liquidity and price levels, providing a more accurate representation of potential drawdowns during backtesting and live operation.
Backtesting Protocol: The strategy is configured for realistic backtesting, employing fill_orders_on_standard_ohlc=true to simulate order execution at standard OHLC prices. A configurable Date Filter is included to define specific historical periods for performance evaluation.
Data Visualization and Metrics: The script provides on-chart visual overlays for buy/sell signals, the ATR trailing stop, and the stop loss level. An integrated information table displays real-time strategy parameters, current position status, trend direction, and key price levels, facilitating immediate quantitative assessment.
Applicability
The Mutanabby_AI | ATR+ strategy is particularly suited for:
Cryptocurrency Markets: The inherent volatility of assets such as #Bitcoin and #Ethereum makes the ATR-based trailing stop a relevant tool for dynamic risk management.
Systematic Trend Following: Individuals employing systematic methodologies for trend capture will find the objective signal generation and rule-based execution aligned with their approach.
Pine Script Developers and Quants: The transparent code structure and emphasis on realistic backtesting provide a valuable framework for further analysis, modification, and integration into broader quantitative models.
Automated Trading Systems: The clear, deterministic entry and exit conditions facilitate integration into automated trading environments.
Implementation and Evaluation
To evaluate the Mutanabby_AI | ATR+ strategy, apply the script to your chosen chart on TradingView. Adjust the input parameters (Key Value, ATR Period, Heikin Ashi Method, Stop Loss Settings) to observe performance across various asset classes and timeframes. Comprehensive backtesting is recommended to assess the strategy's historical performance characteristics, including profitability, drawdown, and risk-adjusted returns.
I'd love to hear your thoughts, feedback, and any optimizations you discover! Drop a comment below, give it a like if you find it useful, and share your results.

SASDv2rSensitive Altcoin Season Detector V2
This Pine Script™ code, titled "SASDv2r" (Sensitive Altcoin Season Detector version 2 revised), is designed for cryptocurrency trading analysis on the TradingView platform and tailored for those interested in tracking when altcoins might be outperforming Bitcoin, potentially indicating a market shift towards altcoins.
Feel free to use and modify. If you made it better, please let me know. Intention was to help the community with a tool for retail traders have no access to advanced, MV indicators. Solution uses classic TA only.
Use it witl TOTAL3/BTC indicator.
Please check: it gave signal just before last alt season % rose more than 250%.
Market Cap Data Fetching: The script fetches market capitalization data for Bitcoin, Ethereum, and all other altcoins (excluding Bitcoin and Ethereum) using request.security function.
Altcoin to Bitcoin Ratio: It calculates the ratio of total market cap of altcoins to Bitcoin's market cap (altToBtcRatio), which is central to identifying an "altcoin season."
Moving Averages: Several moving averages are computed for different time frames (50-day SMA, 200-day SMA, 20-day SMA, and 10-day EMA) to analyze trends in the altcoin to Bitcoin ratio.
Momentum Indicators: The script uses RSI (Relative Strength Index) and MACD (Moving Average Convergence Divergence) to gauge momentum and potential reversal points in the market.
Custom Indicators: It includes Volume Weighted Moving Average (VWMA) and a custom momentum indicator (altMomentum and altMomentumAvg) to provide additional insights into market movements.
Volatility Measurement: Bollinger Bands are calculated to assess volatility in the altcoin to Bitcoin ratio, which helps identify periods of high or low market activity.
Visual Analysis: Various plots are added to the chart for visual interpretation, including the altcoin to Bitcoin ratio, different moving averages, and Bollinger Bands.
Alt Season Detection: The script defines conditions for detecting when an "altcoin season" might be starting, based on crossovers of moving averages, RSI levels, MACD signals, and other custom criteria.
Performance Tracking: After signaling an alt season, the script evaluates the performance over the next 30 days by checking if there's been an increase in the altcoin to Bitcoin ratio, adding labels for positive or negative trends.(this one is in progress). Logic still gives false signals and aim is to identify failed signals.
Visual Signals: Labels are placed on the chart to visually indicate the beginning of a potential alt season or the performance outcome after a signal, aiding traders in making informed decisions.

Altcoin Total Average Divergence (YavuzAkbay)The "Average Price and Divergence" indicator is a strong tool built exclusively for cryptocurrency traders who understand the significance of comparing altcoins to Bitcoin (BTC). While traditional research frequently focusses on the value of cryptocurrencies against fiat currencies such as the US dollar, this indicator switches the focus to the value of altcoins against Bitcoin itself, allowing you to detect potential market opportunities and divergences.
The indicator allows you to compare the price of an altcoin to Bitcoin (e.g., ETHBTC, SOLBTC), which is critical for determining how well an altcoin performs against the main cryptocurrency. This is especially important for investors who expect Bitcoin's price will continue to rise logarithmically and want to ensure that their altcoin holdings retain or expand in market capitalisation compared to Bitcoin.
The indicator computes the average price of the chosen cryptocurrency relative to Bitcoin over the viewable portion of the chart. This average acts as a benchmark, indicating the normal value around which the altcoin's price moves.
The primary objective of this indicator is to calculate and plot the divergence, which is the difference between the altcoin's current price relative to Bitcoin and its average value. This divergence can reveal probable overbought or oversold conditions, allowing traders to make better decisions about entry and exit points.
The divergence is represented as a histogram, with bars representing the magnitude of the difference between the current and average prices. Positive values indicate that the altcoin is trading above its average value in comparison to Bitcoin, whereas negative values indicate that it is trading below its average.
The indicator automatically adjusts to the chart's visible range, ensuring that the average price and divergence are always calculated using the most relevant data. This makes the indicator extremely sensitive to changes in the chart view and market conditions.
How to Use:
A significant positive divergence may imply that the cryptocurrency is overbought in comparison to Bitcoin and is headed for a correction. A significant negative divergence, on the other hand, may indicate that the cryptocurrency has been oversold and is cheap in comparison to Bitcoin.
Tracking how an altcoin's price deviates from its average relative to Bitcoin can provide insights about the market's opinion towards that altcoin. Persistent positive divergence may suggest high market confidence, whilst constant negative divergence may imply a lack of interest or eroding fundamentals.
Use divergence data to better time your trades, either by entering when a cryptocurrency is discounted in comparison to its average (negative divergence) or departing when it is overpriced (positive divergence). This allows you to capture value as the price returns to its mean.
Ideal For:
Cryptocurrency Traders who want to understand how altcoins are performing relative to Bitcoin rather than just against fiat currencies.
Long-term Investors looking to ensure their altcoin investments are maintaining or growing their value relative to Bitcoin.
Market Analysts interested in identifying potential reversals or continuations in altcoin prices based on divergence from their average value relative to Bitcoin.

Entry FraggerEntry Fragger is a simple buy signal indicator.
It is most suitable for cryptocurrency, especially for altcoins on the 5 minute to daily timeframe and is based on simple volume calculations, in combination with EMA's.
Main Signal Logic explained:
A buy signal is generated by counting candles with an above average sell volume of 130% to 170%, taking into account the candles position below and above the 50 and 200 EMA.
If criteria meet, the first green candle above the 50 EMA's suggests upcoming higher prices.
The indicator has 2 input variables.
"Signal Confirmations (0 - 7):" Changes signal accuracy by a defining an ammount of high sell volume candles necessary below the 50 EMA.
"Volume Calculation Base (9 - 200):" Sets the exponential volume multiplier, this affects candle coloring and the volume calculation inside the candle.
"Style Settings": Turn ON/OFF Signals, Cloud, Bar Coloring, EMA's, etc...
There are no generally suitable default numbers for those 2 inputs, those have to be tested out, depending on cryptocurrency and timeframe.
The calculation is very basic, the underlying idea being, market maker initiating range breakouts through rapid increase of volume above or below the EMA's .
Example settings:
SOLUSDT: Signal Confirmations: 2, Volume Calculation Base 13.
SOLUSDT: Signal Confirmations: 0, Volume Calculation Base 20.
As you can see it affects signals quite a lot, but staying accurate.
Finetune the inputs to your preference.
Risk to Reward, Stoploss, Take Profit, position sizing, etc... is up to the user.
Recommended entry is to wait for following candle closes, entering half of the candle size and setting Stoploss outside the structure, like this:
Or right below the candles open, for safety.

Qu_Trend+
composition
- Consists of a thick trend line and a thin yellow line.
- The largest (green/red) lines indicate rising and falling markets.
- This line represents the 13-candle moving average of Tilson T3.
- The reason for 13 candles is because it best matches the recent market price based on Bitcoin.
- This value cannot be changed, so if you need it, please modify the public code and use it.
- The yellow line is the MA20 line, the ‘Bollinger Band center line’
(UI will show whether this line has been breakout)
- The same algorithm as 20 of the basic moving average (close standard) is applied.
- The algorithm for breakthrough is calculated based on real-time prices, not based on closing prices.
An additional short-term SMA is created, and whether it crosses the SMA is classified as a breakout/resistance.
How to use it
- If the trend line becomes gentle, it may indicate a change in trend when + MA20 is broken.
- While the slope of the trend line is steep, it indicates that the trend is difficult to change.
(If the trend changes at this time, it is likely to move sideways)
- If the trend changes continuously, it is a sideways market.
At this time, watch out for the movement of the end point where the sideways trend ends.

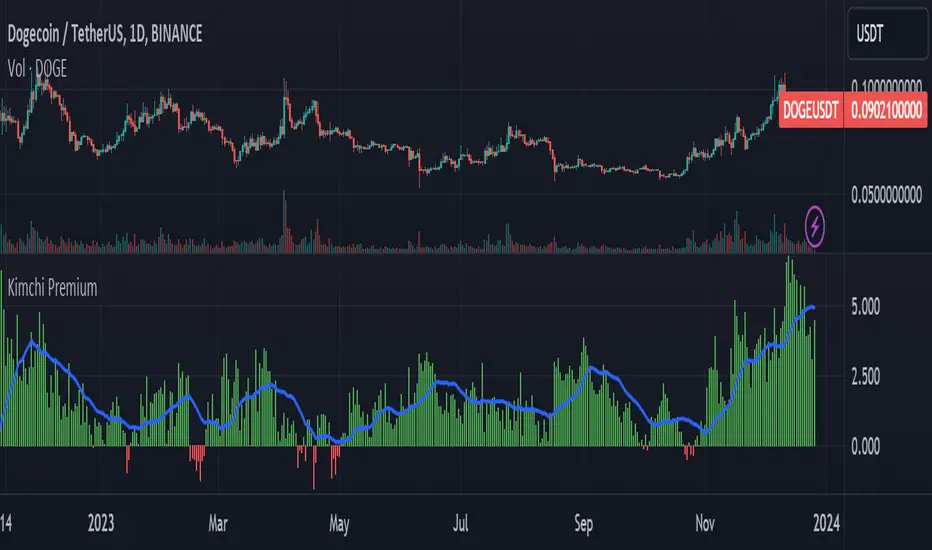
Kimchi Premium / Korean Premium ALL TICKERSKimchi Premium
Due to the isolated nature of Korean crypto markets, Koreans pay a hefty premium on most cryptos. (Usually ranging from 3% to 5%). This is colloquially known as the " Kimchi Premium ".
Uses
The extend of this premium can be used to gauge Korean sentiment towards certain tickers. Most of the insane alt coin rallies that are started by Korean degens are missed by foreign traders entirely. This script seeks to fix that.
Notes
This script automatically detects your current ticker and compares the USDT pair to the KRW pair after adjusting for exchange rate.
Works on all USDT, USDC, BUSD, FDUSD, USD, USDT.P, USDC.P or KRW pairs. Will obviously throw an error if your ticker has no KRW pairing.
Altcoin Dominance (without ETH) Excluding Stablecoins UnsymetricAltcoin Dominance (without ETH) Excluding Stablecoins Unsymetric
The purpose of the script is to show Altcoin's strength without Ethereum once we exclude stablecoins.
So we look into all altcoins besides eth and besides stablecoins divided by a value of eth+btc

Altcoin Dominance Excluding EthereumAltcoin Dominance Excluding Ethereum
The purpose of the script is to show Altcoin's strength without Ethereum.
Pretty much shows Altcoin's Dominance in comparison to Market Cap once we exclude Ethereum.

Altcoin Analyzer [Lysergik]Quickly view any USD-based asset's value relative to Bitcoin without needing to have a separate chart with all its bells and whistles.

Dominion - Bitcoin Altcoin Dominance [mutantdog]A simple and easy reference tool displaying a plot of the market cap dominance values for several significant cryptocurrencies.
The most widely used of these is bitcoin dominance (the top indicator shown above) which calculates the total market cap of bitcoin in relation to the total cryptocurrency market cap, displayed as a percentage. This is commonly used by traders to assess the strength of bitcoin in relation to the broader crypto market; increasing values being indicative of larger bitcoin moves and decreasing values often indicative of potential altcoin cycles. Likewise, ethereum dominance (the bottom indicator shown above) is frequently used as a means to indicate the strength of ethereum in relation to the broader crypto market.
Included options for marketcap dominance values are:
Bitcoin : CRYPTOCAP:BTC.D
Ethereum : CRYPTOCAP:ETH.D
Total DeFi (a composite of multiple top defi tokens): CRYPTOCAP:TOTALDEFI.D
Stablecoins (shows the combined dominance values for usdt and usdc): CRYPTOCAP:USDT.D + CRYPTOCAP:USDC.D
Flippening (shows the difference between bitcoin and ethereum dominance values): CRYPTOCAP:BTC.D - CRYPTOCAP:ETH.D
When used in combination with each other, these can provide a good overview of the general flow of capital within the crypto market.
Additional functionality:
up to three optional moving averages with a choice of SMA, EMA, WMA and RMA for each.
multi timeframe selector
alert condition presets for various moving average crosses.
Please be aware that, while useful as reference, dominance calculations are known to repaint frequently. As such the use of this indicator and its alerts should require caution.

Kifier's ALT-COIN Failed Volume PressureGeneral Idea:
The basic idea is really simple - to detect during a bull-run, good mid-run entries or even predicting the start of a run, and the overcoming of the sell pressure, and I got this idea very naturally while looking back at my entries with ADA 6 months back. The indicator simply detects for you and alerts where volume reaches high reds but the actual price of the asset does not close lower than the previous open. This essentially shows a rejection of the selling pressure, and usually if either in a stagnant or bullish trend will just result in a bullish trend. It’s also great to detect entries into a bull-run mid way, which can happen quite often with cryptos. Due to the reliance of volume in this one, it’s probably best to stick with mid to low cap alt-coins, as BTC and even ETH at this point have a more complicated price action trends.
Usage:
It’s built ideally for long-term timeframes, so 1D is the minimum in my opinion, and it should be used in combination with other indicators to confirm entries and market conditions, plus fundamental analysis is VERY important when it comes to trading with volume as a leading indicator in lower cap alt-coins.
Structure:
The blue line is an average of the volume over a period while the yellow is the current volume, this makes it easy when a volume anomaly occurs and essentially a massive sell-off.
The green/red lines at the bottom unimaginatively is just a simple trend indicator based of two EMAs.
I also want to attempt to make a version for smaller time-frames as well, which needs to also account for market noise and a better trend detection but that’s for a future time.
It’d be great to hear feedback and even ideas on beneficial changes!
Arbitrage Sniper (POC)Good Morning Traders!
Today I want to share with you the proof-of-concept of how you would be able to do arbitrage with crypto pairs.
THE INDICATOR MUST BE PLACED ON THE TRADING PAIR OF THE TWO CURRENCIES (i.e. ETH/BTC, EOS/ETH etc.)
This arbitrage method is based on the transitional decorrelation between the crypto treding pair and the price ratio of the involved currencies, of course computing commissions as well.
Whenever the non-arbitrage condition is not respected, there is an arbitrage oportunity.
This indicator won't consider the chance of shorting, so if the arbitrage oportunity occurs the indicator will suggest you just the chance of buying the relative-undervalued currency (but inside the code you will know how to do the alternative method as well, by shorting the relative-overvalued currency)
Let's take the trading pair ETH/BTC (as in the graph) → if we assume commissions for the 0.075% of the order, the non-arbitrage condition will be presented like this
This arbitrage method will need three orders, so n=3
So let's assume that P(ETH)/(P(BTC)*P(ETH/BTC))>(1-0.075)^(-3) → it means that the price of Ethereum is currently overreated enough (relatively to the trading pair) for doing arbitrage.
We have two alternatives:
• Buy BTC, change it into ETH (by "buying" ETH in the trading pair ETH/BTC) and then sell ETH
• Sell ETH, buy BTC, change it into ETH (by "buying" ETH in the trading pair ETH/BTC)
On the other hand, if P(ETH)/(P(BTC)*P(ETH/BTC))<(1-0.075)^(-3) → it means that the price of Ethereum is currently underrared enough (relatively to the trading pair) for doing arbitrage.
We have two alternatives:
• Buy ETH, change it into BTC (by "selling" ETH in the trading pair ETH/BTC) and then sell BTC
• Sell BTC, buy ETH, change it into BTC (by "selling" ETH in the trading pair ETH/BTC)
I'm saying that is nothing more than a proof-of-concept since:
- Arbitrage Oportunities will emerge frequently just nearly zero commissions
- Data of prices are retrieved using security() function and there can be some delay (so the arbitrage oportunity will be already extinguished by the time the signal is retrieved)
- In order to have the freshest data, repiainting will occurr

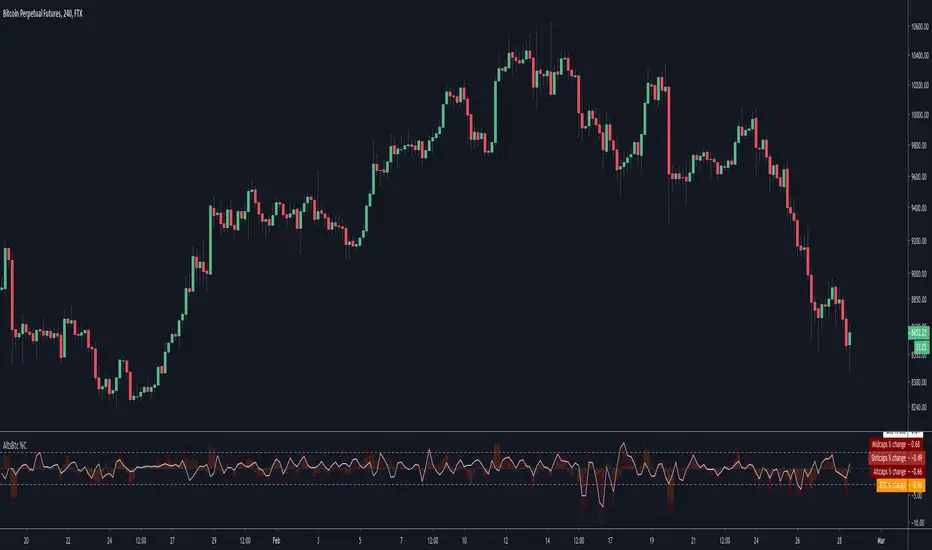
Alts vs Btc percentage changesCatch differences and over-corrections between Alts and Bitcoin via Ftx's indexes
A more visual description : i.imgur.com
Price Streak Is Another Way to Spot TrendsPrice is never wrong, but sometimes reading it can be tricky.
Movements in the broader market or a sector can distract from a symbol that's been steadily trending in one direction or another. Sometimes the beginning of a move can also be so subtle that it flies under most people's radar.
Price Streak can help overcome these limitations by tracking consecutive up/down periods. It plots an easy-to-read color-coded histogram.
Because it simply counts the candles in a trend, Price Streak can give a clearer picture than magnitude-biased indicators like relative strength or MACD.
Applying Price Streak to the daily chart of Bitcoin Dominance , we find something very interesting right now: the longest drop since March 2017.
That moment in history, almost three years ago, marked the beginning of the last Altcoin bull market. Ethereum , for example, went from roughly $60 to over $1,300 in the following nine months.
While past performance isn't a guarantee of future results, this illustrates how sustained price moves can reveal changes in character.
Based on Price Streak's current reading, it may support the idea of another Altcoin cycle beginning now.

Altcoin Cap vs Bitcoin Cap RSIFollowing Willy Woo study of Altcoin Cap vs Bitcoin Cap RSI
charts.woobull.com
BullShrimp's 10EMAsA simple bundle of EMAs with some odd numbers that I found good confluence on 15min, 1h, 4h, 12h, 1d, 1w on BTC and on ALTS.
Works good for dynamic S/R on LTF and high probability target on MTF and HTF.
Try it out during your scans.
Lemme know what you think.
Coinbase ALT/USD IndexA simple ALT/USD pair index of all the altcoins currently trading on Coinbase.

What is ProfitableBTC, BNB or your favorite Alt Coin? This indicator shows what is profitable at the moment. Red bars are alt days, green bars are BTC days. Otherwise, it is a BNB day.
Hmm, most of the time it is a BNB day!
